XRP’s network activity drops, signaling potential price decline to $0.80. Whale sell-offs increase, putting pressure on XRP’s critical support levels. RSI and XRP’s network activity drops, signaling potential price decline to $0.80. Whale sell-offs increase, putting pressure on XRP’s critical support levels. RSI and

Why XRP Might Plunge to $0.80: Key Signs Point to a Potential Price Crash

  • XRP’s network activity drops, signaling potential price decline to $0.80.
  • Whale sell-offs increase, putting pressure on XRP’s critical support levels.
  • RSI and Bollinger Bands hint at further downside risk for XRP.

The XRP community is growing increasingly concerned after a recent update from Ali Charts, which raised alarms about a potential price drop. According to Ali Charts, XRP could be at risk of a significant decline, potentially falling to $0.80. This warning comes as network activity has cooled, and whale sell-offs are increasing, adding pressure to an already fragile market.


Recent data shows that daily active addresses on the XRP network have sharply decreased. In just a week, the number of active addresses has dropped from 46,000 to 38,500, signaling a notable decline in user participation and engagement. This drop in network activity indicates weakening investor interest and raises questions about XRP’s ability to maintain its current price levels.


Also Read: Crypto Market Update: Bitcoin and Ethereum Experience Modest Gains


Furthermore, whale activity is adding to the downward pressure. Over the past few days, whales have sold off more than 40 million XRP tokens. This selling spree suggests that large holders of XRP are losing confidence in the token’s future performance. If these trends continue, the selling pressure could escalate, pushing XRP’s price down further.


XRP is currently hovering around a critical support level at $1.77. According to Ali Charts, if XRP fails to hold above this level, the next major support zone lies near $0.80. A breakdown below this level could lead to a significant price drop, with the possibility of further losses for investors in the short term.


Declining Participation and Increased Selling Pressure Could Lead to Major Losses

The combination of reduced network activity and the increasing sell-offs by whales is raising serious concerns for XRP’s price stability. Historically, whale movements have had a major impact on XRP’s price, and their recent sell-offs are a clear sign that the market sentiment is turning bearish. Additionally, the drop in daily active addresses indicates that investor confidence is waning, further contributing to the negative outlook.


For XRP to avoid a potential collapse, there will need to be a significant rebound in both network participation and buying interest. If this doesn’t happen soon, the cryptocurrency could face even more downward pressure. Investors will need to carefully monitor XRP’s price movements in the coming days, as a failure to hold key support levels could result in a sharp decline, with $0.80 becoming a critical price point to watch.


XRP Price Action and RSI Signal Possible Drop

Analyzing the recent price action of XRP on the chart reveals further bearish signs. Currently, XRP is trading just below the $1.90 level, and the Relative Strength Index (RSI) is sitting at 41.74, indicating that the token is in neutral territory but edging toward oversold conditions. This suggests that there is still room for a potential decline if selling pressure continues.
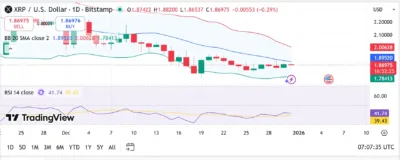

XRP

Source: Tradingview

The Bollinger Bands on the chart show that XRP is trading closer to the lower band, which typically indicates that the price is at risk of further downside. As the price hovers near key support levels and the RSI indicates weakening momentum, XRP could be headed for a drop toward the $0.80 support zone if these trends persist.


Also Read: Prenetics Cancels Bitcoin Acquisition Plans, Focuses on Expanding IM8 Supplement Brand


The post Why XRP Might Plunge to $0.80: Key Signs Point to a Potential Price Crash appeared first on 36Crypto.

Market Opportunity
WHY Logo
WHY Price(WHY)
$0.0000000127
$0.0000000127$0.0000000127
+0.63%
USD
WHY (WHY) Live Price Chart
Disclaimer: The articles reposted on this site are sourced from public platforms and are provided for informational purposes only. They do not necessarily reflect the views of MEXC. All rights remain with the original authors. If you believe any content infringes on third-party rights, please contact service@support.mexc.com for removal. MEXC makes no guarantees regarding the accuracy, completeness, or timeliness of the content and is not responsible for any actions taken based on the information provided. The content does not constitute financial, legal, or other professional advice, nor should it be considered a recommendation or endorsement by MEXC.

You May Also Like

Shiba Inu Price Forecast: Why This New Trending Meme Coin Is Being Dubbed The New PEPE After Record Presale

Shiba Inu Price Forecast: Why This New Trending Meme Coin Is Being Dubbed The New PEPE After Record Presale

While Shiba Inu (SHIB) continues to build its ecosystem and PEPE holds onto its viral roots, a new contender, Layer […] The post Shiba Inu Price Forecast: Why This New Trending Meme Coin Is Being Dubbed The New PEPE After Record Presale appeared first on Coindoo.
Share
Coindoo2025/09/18 01:13
Here’s why Polygon price is at risk of a 25% plunge

Here’s why Polygon price is at risk of a 25% plunge

Polygon price continued its freefall, reaching its lowest level since April 21, as the broader crypto sell-off gained momentum. Polygon (POL) dropped to $0.1915, down 32% from its highest point in May and 74% below its 2024 peak. The crash…
Share
Crypto.news2025/06/19 00:56
North America Sees $2.3T in Crypto

North America Sees $2.3T in Crypto

The post North America Sees $2.3T in Crypto appeared on BitcoinEthereumNews.com. Key Notes North America received $2.3 trillion in crypto value between July 2024 and June 2025, representing 26% of global activity. Tokenized U.S. treasuries saw assets under management (AUM) grow from $2 billion to over $7 billion in the last twelve months. U.S.-listed Bitcoin ETFs now account for over $120 billion in AUM, signaling strong institutional demand for the asset. . North America has established itself as a major center for cryptocurrency activity, with significant transaction volumes recorded over the past year. The region’s growth highlights an increasing institutional and retail interest in digital assets, particularly within the United States. According to a new report from blockchain analytics firm Chainalysis published on September 17, North America received $2.3 trillion in cryptocurrency value between July 2024 and June 2025. This volume represents 26% of all global transaction activity during that period. The report suggests this activity was influenced by a more favorable regulatory outlook and institutional trading strategies. A peak in monthly value was recorded in December 2024, when an estimated $244 billion was transferred in a single month. ETFs and Tokenization Drive Adoption The rise of spot Bitcoin BTC $115 760 24h volatility: 0.5% Market cap: $2.30 T Vol. 24h: $43.60 B ETFs has been a significant factor in the market’s expansion. U.S.-listed Bitcoin ETFs now hold over $120 billion in assets under management (AUM), making up a large portion of the roughly $180 billion held globally. The strong demand is reflected in a recent resumption of inflows, although the products are not without their detractors, with author Robert Kiyosaki calling ETFs “for losers.” The market for tokenized real-world assets also saw notable growth. While funds holding tokenized U.S. treasuries expanded their AUM from approximately $2 billion to more than $7 billion, the trend is expanding into other asset classes.…
Share
BitcoinEthereumNews2025/09/18 02:07