Home » BTC
}
function loadTrinityPlayer(targetWrapper, theme,extras=””) {
cleanupPlayer(targetWrapper); // Always clean first ✅
targetWrapper.classList.add(‘played’);
// Create script
const scriptEl = document.createElement(“script”);
scriptEl.setAttribute(“fetchpriority”, “high”);
scriptEl.setAttribute(“charset”, “UTF-8”);
const scriptURL = new URL(`https://trinitymedia.ai/player/trinity/2900019254/?themeAppearance=${theme}${extras}`);
scriptURL.searchParams.set(“pageURL”, window.location.href);
scriptEl.src = scriptURL.toString();
// Insert player
const placeholder = targetWrapper.querySelector(“.add-before-this”);
placeholder.parentNode.insertBefore(scriptEl, placeholder.nextSibling);
}
function getTheme() {
return document.body.classList.contains(“dark”) ? “dark” : “light”;
}
// Initial Load for Desktop
if (window.innerWidth > 768) {
const desktopBtn = document.getElementById(“desktopPlayBtn”);
if (desktopBtn) {
desktopBtn.addEventListener(“click”, function () {
const desktopWrapper = document.querySelector(“.desktop-player-wrapper.trinity-player-iframe-wrapper”);
if (desktopWrapper) loadTrinityPlayer(desktopWrapper, getTheme(),’&autoplay=1′);
});
}
}
// Mobile Button Click
const mobileBtn = document.getElementById(“mobilePlayBtn”);
if (mobileBtn) {
mobileBtn.addEventListener(“click”, function () {
const mobileWrapper = document.querySelector(“.mobile-player-wrapper.trinity-player-iframe-wrapper”);
if (mobileWrapper) loadTrinityPlayer(mobileWrapper, getTheme(),’&autoplay=1′);
});
}
function reInitButton(container,html){
container.innerHTML = ” + html;
}
// Theme switcher
const destroyButton = document.getElementById(“checkbox”);
if (destroyButton) {
destroyButton.addEventListener(“click”, () => {
setTimeout(() => {
const theme = getTheme();
if (window.innerWidth > 768) {
const desktopWrapper = document.querySelector(“.desktop-player-wrapper.trinity-player-iframe-wrapper”);
if(desktopWrapper.classList.contains(‘played’)){
loadTrinityPlayer(desktopWrapper, theme,’&autoplay=1′);
}else{
reInitButton(desktopWrapper,’Listen‘)
const desktopBtn = document.getElementById(“desktopPlayBtn”);
if (desktopBtn) {
desktopBtn.addEventListener(“click”, function () {
const desktopWrapper = document.querySelector(“.desktop-player-wrapper.trinity-player-iframe-wrapper”);
if (desktopWrapper) loadTrinityPlayer(desktopWrapper,theme,’&autoplay=1’);
});
}
}
} else {
const mobileWrapper = document.querySelector(“.mobile-player-wrapper.trinity-player-iframe-wrapper”);
if(mobileWrapper.classList.contains(‘played’)){
loadTrinityPlayer(mobileWrapper, theme,’&autoplay=1′);
}else{
const mobileBtn = document.getElementById(“mobilePlayBtn”);
if (mobileBtn) {
mobileBtn.addEventListener(“click”, function () {
const mobileWrapper = document.querySelector(“.mobile-player-wrapper.trinity-player-iframe-wrapper”);
if (mobileWrapper) loadTrinityPlayer(mobileWrapper,theme,’&autoplay=1′);
});
}
}
}
}, 100);
});
}
})();
Summarize with AI
Summarize with AI
Bitcoin is still in a corrective phase after the sharp selloff, and the price is now trying to stabilize around $66,000. The bigger picture is simple, as momentum is bearish on the daily time frame, but short-term structure is tightening. So, the next breakout from consolidation likely decides whether this is a bottom or just a pause before another leg down.
Bitcoin Price Analysis: The Daily Chart
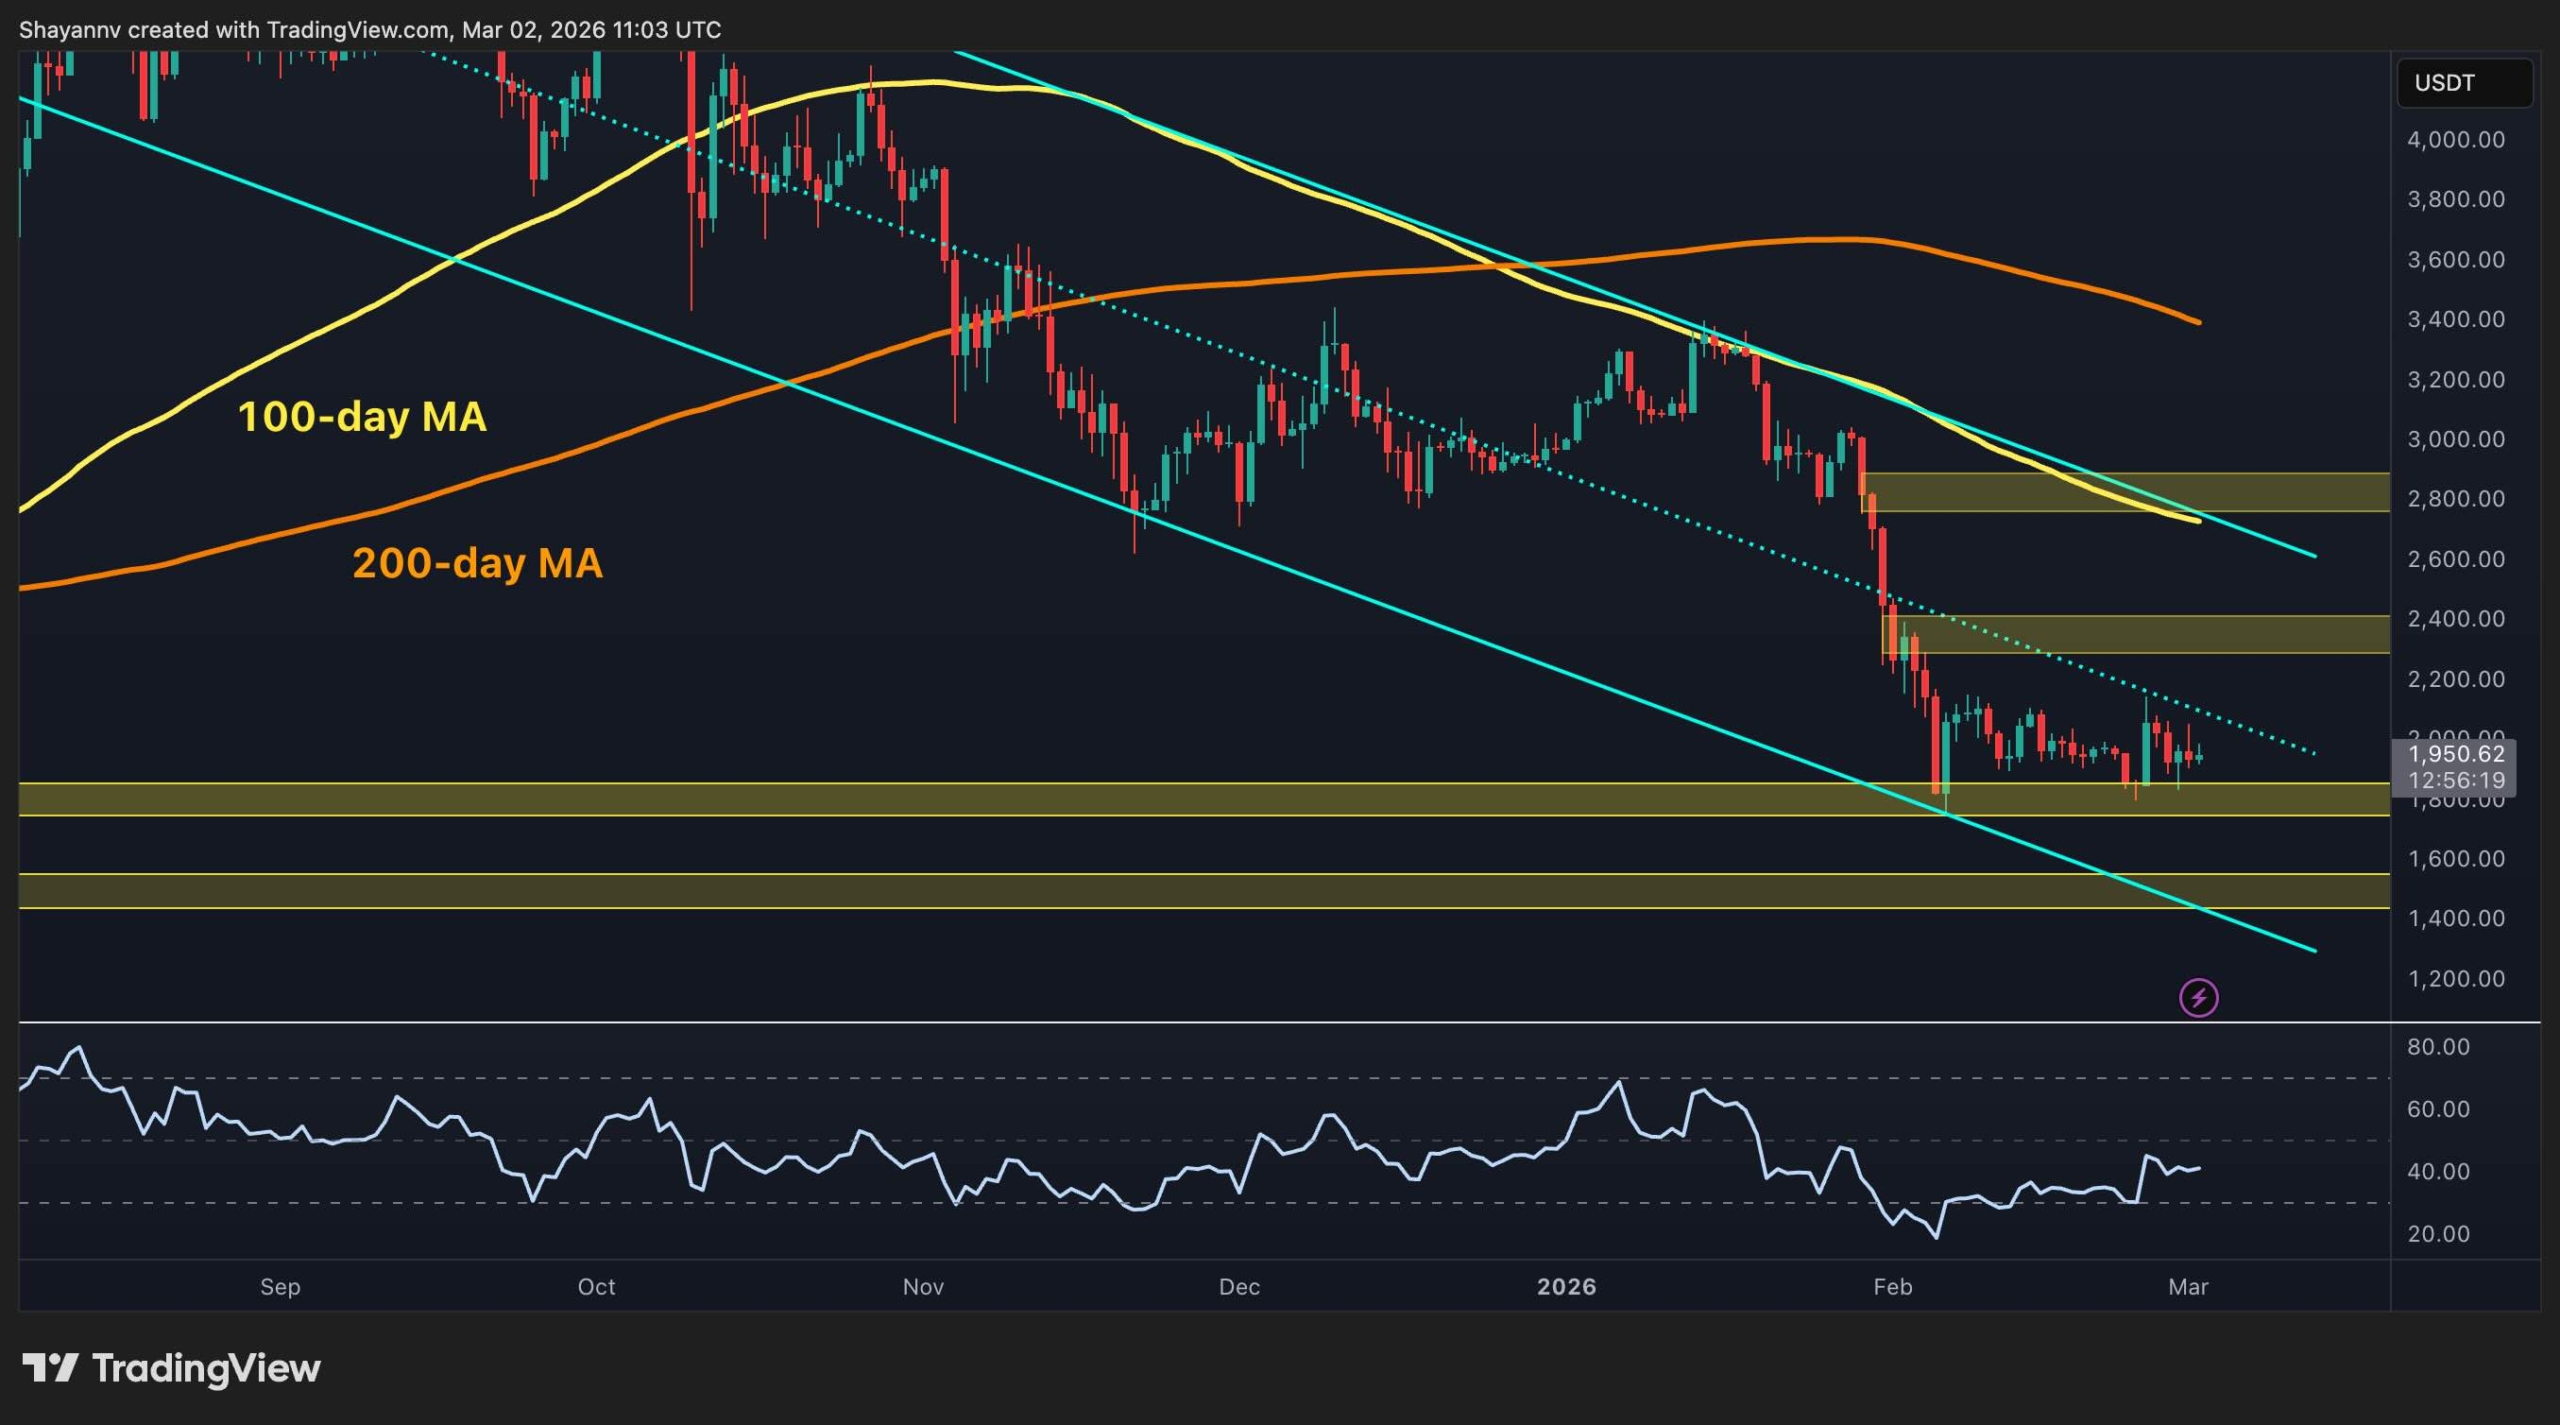
On the daily chart, BTC remains below the 100-day and the 200-day moving averages, indicating the overall bearish trend. The price is also trading inside a broader downward channel, and the breakdown from the prior support area around $75,000-$80,000 has turned that zone into a key supply region. As long as Bitcoin stays below the mid $70,000s, rallies can still be sold into, especially if they fail near the moving averages.
The near-term demand zone to watch sits around $60,000, where buyers previously stepped in and where the market is likely to defend again if volatility returns. If that floor breaks cleanly, the next major support area comes in around $50,000 to $53,000. Meanwhile, the RSI has recovered from the most oversold readings, but it is still not showing the kind of strength you usually see at the start of a new uptrend, so confirmation matters more than hope here.
BTC/USDT 4-Hour Chart
On the 4-hour chart, Bitcoin is compressing into a symmetrical triangle after the dump, with lower highs capping the price while the lows are holding higher. This kind of structure often precedes a decisive move because liquidity builds on both sides. The upper trigger is near $68,000, and a clean break and hold above it can open a push toward $73,000, where the larger resistance zone begins.
If the triangle breaks to the downside, the first test is typically the range low around $62,000, followed by the deeper daily demand zone around $60,000. The key detail is that the current consolidation is happening after a strong down move, so downside breaks can accelerate quickly if bids step away. Therefore, buyers will need a breakout that holds, not just a wick, because fake outs are common when the broader trend is still down.
Sentiment Analysis
The open interest chart shows a steep decline into the current period, dropping toward about $20.4B, while the price also fell sharply. That combination usually signals forced deleveraging, meaning liquidations and position closures rather than a calm, organic pullback. In practice, it often marks the point where the market flushes out excessive leverage, which can reduce immediate downside pressure.
The next clue is what happens if open interest starts rising again. If open interest rebuilds while the price holds above $62,500 and pushes above $68,000, it suggests traders are re-entering with confidence, which can support a continuation rally. However, if open interest climbs while the asset stays heavy and fails under $68,000, it can set up another liquidation wave, because fresh leverage tends to become fuel for the next squeeze down when the trend is still bearish.
Binance Free $600 (CryptoPotato Exclusive): Use this link to register a new account and receive $600 exclusive welcome offer on Binance (full details).
LIMITED OFFER for CryptoPotato readers at Bybit: Use this link to register and open a $500 FREE position on any coin!
Disclaimer: Information found on CryptoPotato is those of writers quoted. It does not represent the opinions of CryptoPotato on whether to buy, sell, or hold any investments. You are advised to conduct your own research before making any investment decisions. Use provided information at your own risk. See Disclaimer for more information.
Source: https://cryptopotato.com/bitcoin-price-analysis-why-bitcoin-must-clear-68k-to-avoid-another-big-leg-down/