

Cash Flow Valuation HyperLiquid: Could $HYPE Reach $385 in Five Years?
Author: G3ronimo
Compiled by: TechFlow
HyperLiquid has grown into a mature crypto-native exchange, with the majority of its net fees programmatically distributed directly to token holders through an "Assistance Fund" (AF). This design makes $HYPE one of the few tokens capable of being valued based on cash flow. To date, most valuations of HyperLiquid have relied on traditional multiples, comparing it to established financial platforms like Coinbase and Robinhood, using EBITDA or revenue multiples as a reference.
Unlike traditional corporate stocks, where management typically retains and reinvests earnings at their discretion, HyperLiquid systematically returns 93% of transaction fees directly to token holders through a support fund. This model creates predictable and quantifiable cash flows, making it well-suited for detailed discounted cash flow (DCF) analysis rather than static multiple comparisons.
Our methodology begins by determining $HYPE's cost of capital. We then invert the current market price to determine the market-implied future earnings. Finally, we apply growth projections to these earnings streams and compare the resulting intrinsic value to today's market price, revealing the valuation gap between current pricing and fundamental value.
Why choose discounted cash flow (DCF) over a multiple?
While other valuation methods compare HyperLiquid to Coinbase and Robinhood via EBITDA multiples, these methods have the following limitations:
- The difference between the corporate and token structures: Coinbase and Robinhood are corporate stocks, whose capital allocation is guided by the board of directors, and profits are retained and reinvested by management; while HyperLiquid systematically returns 93% of trading fees directly to token holders through a relief fund.
- Direct Cash Flow: HyperLiquid's design generates predictable cash flows that are well-suited to DCF models, rather than static multiples.
- Growth and risk characteristics: DCFs are able to explicitly model different growth scenarios and risk adjustments, whereas multiples may not adequately capture growth and risk dynamics.
Determining an appropriate discount rate
To determine our cost of equity, we start with reference data from the public market and adjust for cryptocurrency-specific risks:
Cost of equity (r) ≈ Risk-free rate + β × Market risk premium + Crypto/illiquidity premium
Beta Analysis
Based on regression analysis with the S&P 500:
- Robinhood (HOOD): Beta of 2.5, implied cost of equity of 15.6%;
- Coinbase (COIN): Beta of 2.0, implied cost of equity of 13.6%;
- HyperLiquid (HYPE): Beta is 1.38 and the implied cost of equity is 10.5%.
At first glance, $HYPE appears to have a lower beta, and therefore a lower cost of equity than Robinhood and Coinbase. However, the R² value reveals an important limitation:
- HOOD: The S&P 500 explains 50% of its returns;
- COIN: The S&P 500 explains 34% of its return;
- HYPE: The S&P 500 only explains 5% of its returns.
$HYPE’s low R² suggests that traditional stock market factors are insufficient to explain its price fluctuations, and crypto-native risk factors need to be considered.
risk assessment
Despite $HYPE’s lower beta, we still adjust its discount rate from 10.5% to 13% (which is more conservative compared to COIN’s 13.6% and HOOD’s 15.6%) for the following reasons:
- Lower governance risk: Direct programmatic distribution of 93% of fees reduces concerns about corporate governance. In contrast, COIN and HOOD do not return any earnings to shareholders, and their capital allocation is determined by management.
- Higher Market Risk: $HYPE is a crypto-native asset and is subject to additional regulatory and technological uncertainties.
- Liquidity considerations: Token markets are generally less liquid than established stock markets.
Get the Market Implied Price (MIP)
Using our 13% discount rate, we can reverse engineer the market’s implied earnings expectations at the current $HYPE token price of approximately $54:
Current market expectations:
- 2025: Total revenue of $700 million
- 2026: Total revenue of $1.4 billion
- Terminal growth: 3% annual growth thereafter
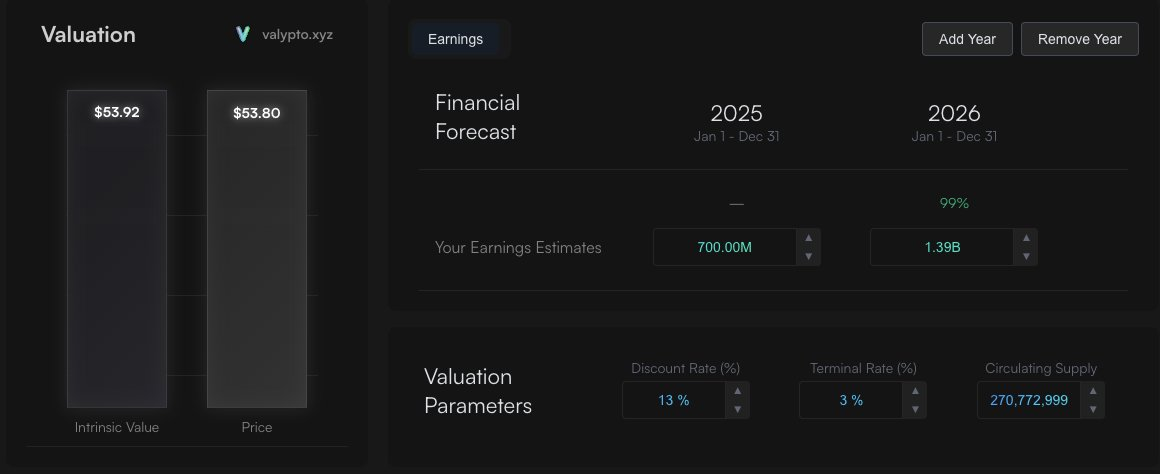
These assumptions yield an intrinsic value of approximately $54, which is consistent with current market prices. This suggests that the market is pricing in modest growth based on current fee levels.
At this point we need to ask a question: Does the market-implied price (MIP) reflect future cash flows?
Alternative growth scenarios
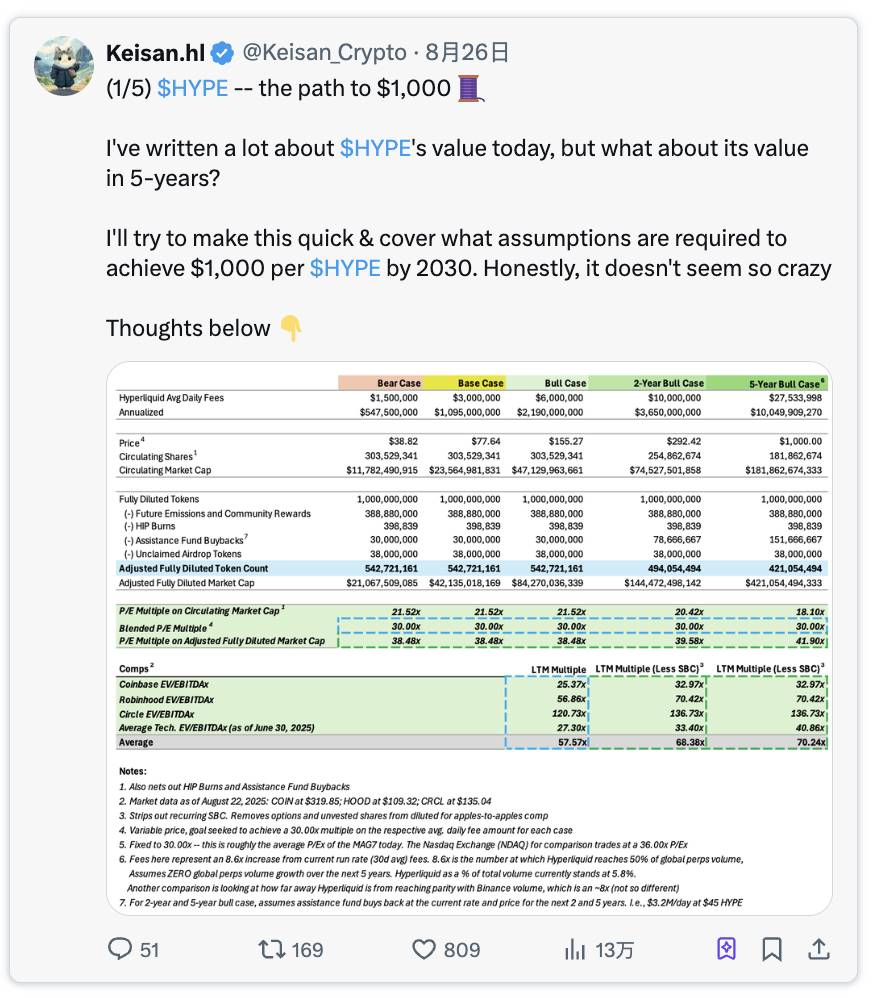
@Keisan_Crypto presents an attractive 2-year and 5-year bull market scenario.
Original tweet link: Click here
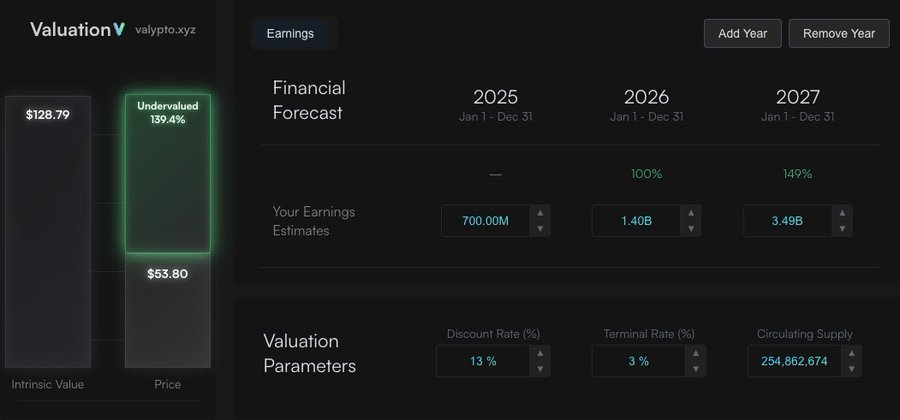
Two-year bull market forecast
According to @Keisan_Crypto’s analysis, if HyperLiquid achieves the following goals:
- Annualized fees: $3.6 billion
- Aid fund income: $3.35 billion (93% of fees)
Result: HYPE's intrinsic value is $128 (140% undervalued at current price)
Related links
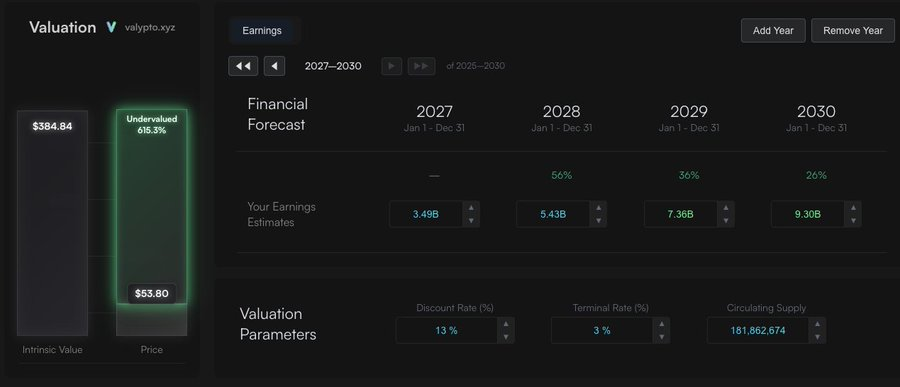
Five-year bull market scenario
Under a five-year bull market scenario (link), he predicts that transaction fees will reach $10 billion annually, with $9.3 billion accruing to $HYPE. He assumes HyperLiquid's global market share will grow from its current 5% to 50% by 2030. Even if it doesn't reach 50% market share, these figures are still achievable with a smaller market share as global trading volumes continue to grow.
Five-year bull market forecast
- Annualized fees: $10 billion
- Aid fund income: $9.3 billion
Result: HYPE's intrinsic value is $385 (600% undervalued at current price)
Related links
While this valuation is lower than Keisan's $1,000 target, the difference stems from our assumption of normalized earnings growth at 3% annually thereafter, while Keisan's model uses a cash flow multiple. We believe using cash flow multiples to project long-term value is problematic, as market multiples are volatile and can vary significantly over time. Furthermore, the multiples themselves incorporate earnings growth assumptions, while using the same cash flow multiple five years from now as one or two years later implies that growth levels from 2030 onward will be consistent with those in 2026/2027. Therefore, the multiples are more appropriate for short-term asset pricing. However, regardless of which model is used, $HYPE remains undervalued; this is a subtle difference.
Additional Value Driver: USDH
Under the Native Market model, USDH will use 50% of its stablecoin revenue for buybacks similar to a bailout fund. As a result, $HYPE can increase its free cash flow by $100 million (50% of $200 million) annually.
Looking ahead five years, if USDH's market capitalization reaches $25 billion (currently still one-third of USDC's, and an even smaller portion of the total stablecoin market five years from now), its annual revenue could reach $1 billion. Following the same 50% distribution model, this would generate an additional $500 million in free cash flow per year for the aid fund. This would value each token at over $400.
Excluding Value Drivers: HIP-3 and HyperEVM
This DCF analysis intentionally excludes two important potential value drivers that are not amenable to cash flow modeling. Clearly, these would provide additional incremental value and could therefore be evaluated separately using different valuation methodologies and then added to this valuation.
Summarize
Our DCF analysis indicates that if HyperLiquid can maintain its growth trajectory and market position, the $HYPE token is significantly undervalued. The token's unique feature of programmatic fee distribution makes it particularly suitable for cash flow-based valuation methodologies.
Methodological Notes
This analysis builds on research by @Keisan_Crypto and @GLC_Research.
The DCF model is open source and can be modified at the following link:
Market data and forecasts are subject to change, and models should be updated promptly based on the latest information.
You May Also Like

Spot Demand Rises as Bull Flag Breaks

XRP Stabilizes After Correction While Open Interest Cools
