

Solana Price Climbs 3.5% Amid Broader Market Volatility
Solana’s price is stuck in a technical bear market after falling by 59% from its highest level in September last year. However, after forming a double-bottom pattern, the SOL price seems to have reached a key support level around $113, a drop which came amid a broader crypto market drop this week.
The crypto token is now attempting a recovery, which is in tandem with the broader market, which edged up a fraction of a percentage to a $2.91 trillion market capitalization, according to Coingecko data.
The Solana price has climbed 3.5% in the last 24 hours, despite being down 7.5% in the last week to trade at $117.30 as of 03:02 a.m. EST. However, trading activity has fallen dramatically, with SOL’s trading volume climbing 28% to $5.6 billion.
Gold, Silver Slide as Markets Weigh Trump Nominee
Wall Street’s main indexes closed lower on Friday as investors viewed President Donald Trump’s nomination of former Federal Reserve Governor Kevin Warsh as a hawkish choice to succeed Federal Reserve Chair Jerome Powell.
According to Trump and many economists, Warsh is expected to favor lower interest rates but stop short of the more aggressive monetary easing linked to some other potential nominees.
With Powell’s term ending in May, Warsh, if confirmed by the Senate, would take the helm of the central bank.
On top of assessing the risks from US tensions with countries including Iran, investors were also worried about the prospect of another US government shutdown after new barriers emerged in the Senate to a deal that would ensure continuation of funding for agency operations.
The US government entered what is expected to be a brief shutdown on Saturday after the Senate failed to approve a deal to keep a wide swath of operations funded ahead of a midnight deadline.
As a result, the Dow Jones Industrial Average fell 179.09 points, or 0.36%, to 48,892.47, the S&P 500 lost 29.98 points, or 0.43%, to 6,939.03, and the Nasdaq Composite lost 223.30 points, or 0.94%, to 23,461.82.
The rate-sensitive, small-cap Russell 2000 index has recently been outperforming large-cap indexes, but on Friday it lagged with a 1.6% loss for the day.
In the last 48 hours, over $7 trillion has been erased from the precious metal market. Silver is down 29% and has dropped to around $85/ounce, while gold is down 8.15% to trade at $4,893.2/ounce.
Amid these downtrends, can the Solana price continue soaring after such a positive gain in the last day?
SOL Price Technical Analysis Points to a Sustained Drop
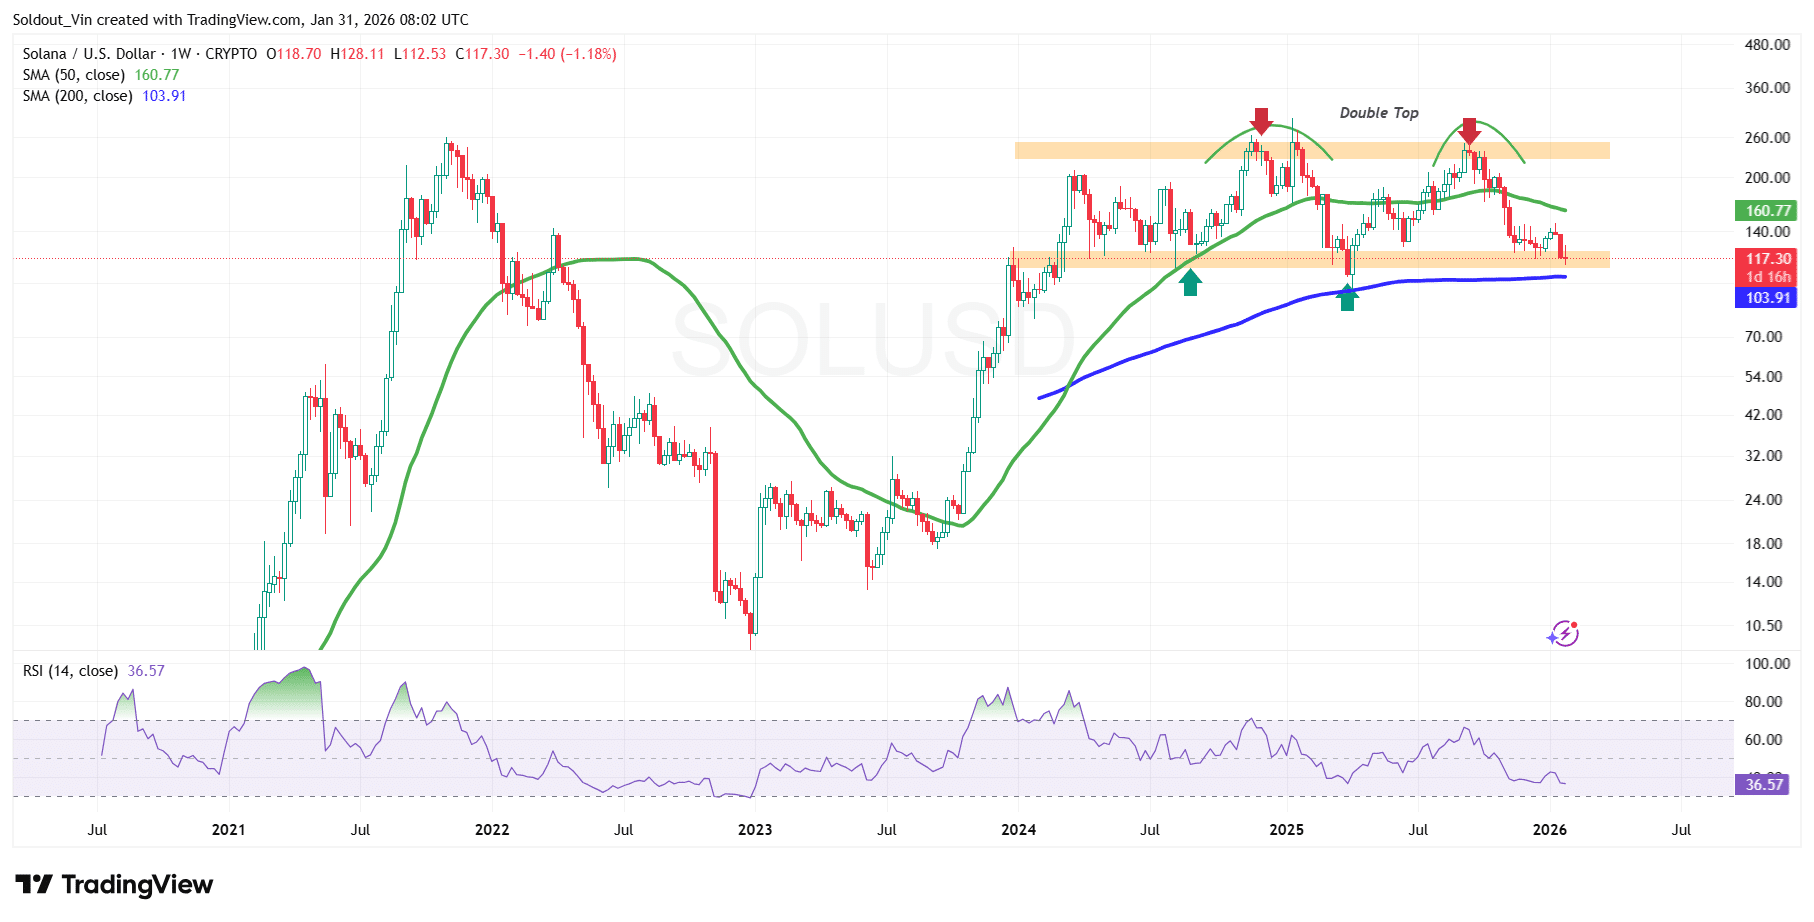
Solana price is trading within an intraday low of around $114.83 and a high of $118.61, just within the highlighted neckline of the double top pattern, which in most cases acts as a bearish sign.
The bearish sentiment continues as the SOL price trades well below the 50-day Simple Moving Average (SMA) on the weekly chart, but is being held above the $113 support by the 200-day SMA, now at $103.91. ‘
Meanwhile, Solana’s Relative Strength Index (RSI) is still dropping on the weekly timeframe, currently at 36.57 and still dropping, which shows that bears are still in control in the long term.
 SOL/USD Chart Analysis Source: TradingView
The 200-day SMA now acts as a long-term cushion against downward pressure. If the bears manage to cross this support area, the price of SOL could still drop even further.
Technicals now point to a continued drop as the market faces continued volatility. If this support is breached, Solana faces a risk of a drop to the August 2023 resistance area around $47.3.
On the upside, the 50-day SMA at $160.77 acts as the next key resistance and target. Historically, buyers have used the $113 support to stage a recovery. If buyers step in at this level and break the 50-day SMA, the next key target will be the $229 level to the upside.
Related News:
You May Also Like
Colombians can soon save in stablecoins with new MoneyGram App
Colombians will soon be able to receive and store USDC through MoneyGram’s new crypto app, which is launching soon in app stores. MoneyGram’s digital payments app is set to launch in Colombia, offering locals a way to save in US dollar stablecoins as the Colombian peso continues to weaken.MoneyGram’s crypto service is powered by the Stellar network and leverages Crossmint for self-custody, enabling users to store the USDC (USDC) stablecoin and transfer it overseas nearly instantly. In a statement on Wednesday, MoneyGram said Colombia is the “ideal launch market” as Colombian families receive more than 22 times the money they send abroad.Read more

MYX Finance price surges again as funding rate points to a crash


