

Ethereum Price Outlook: Bearish Structure Puts $1,666 ETH Target in Play
TLDR
- ETH shows repeated intraday distribution with rallies sold into local liquidity zones.
- Failure to hold the $2,000–$2,100 range confirms growing seller control.
- A confirmed bear flag breakdown signals continuation of the broader downtrend.
- Measured move from the bear flag targets ETH price near the $1,666 level.
Ethereum (ETH) price continues to trade under sustained pressure as multiple analyses point toward ongoing distribution and weak recovery attempts. Recent intraday manipulation, loss of key support near $2,000, and a confirmed bear flag breakdown have shifted market focus toward lower liquidity targets. Analysts are now monitoring downside levels, with $1,666 emerging as a key technical objective.
Ethereum Price Shows Repeated Intraday Distribution
According to analyst Molenaar, Ethereum price action on lower timeframes reflects repeated downside manipulation rather than organic recovery. Short-lived upward spikes into local liquidity zones have consistently been followed by sharp sell-offs. These moves indicate distribution behavior, where rallies are used to offload positions instead of building sustainable momentum.

Structurally, Ethereum remains trapped in a short-term bearish trend defined by lower highs and compressed ranges. Buyers have failed to generate impulsive upside moves capable of reclaiming meaningful structure. As a result, each rejection reinforces the view that upside attempts remain liquidity-driven rather than trend-changing.
Looking ahead, Jip’s projected path suggests another downside sweep after brief consolidation. Unless Ethereum price can decisively break above and hold prior manipulation zones, bearish bias remains intact. In this zone, downside liquidity continues to act as a stronger magnet than recovery targets.
ETH Price Struggles to Hold $2,000 Support
Additionally, according to Ted Pillows, Ethereum price is facing mounting pressure around the historically important $2,000–$2,100 demand zone. The chart shows multiple failed attempts to reclaim resistance levels, confirming a transition from consolidation into distribution. The early 2026 sell-off reflects growing seller dominance and weakening dip-buying interest.
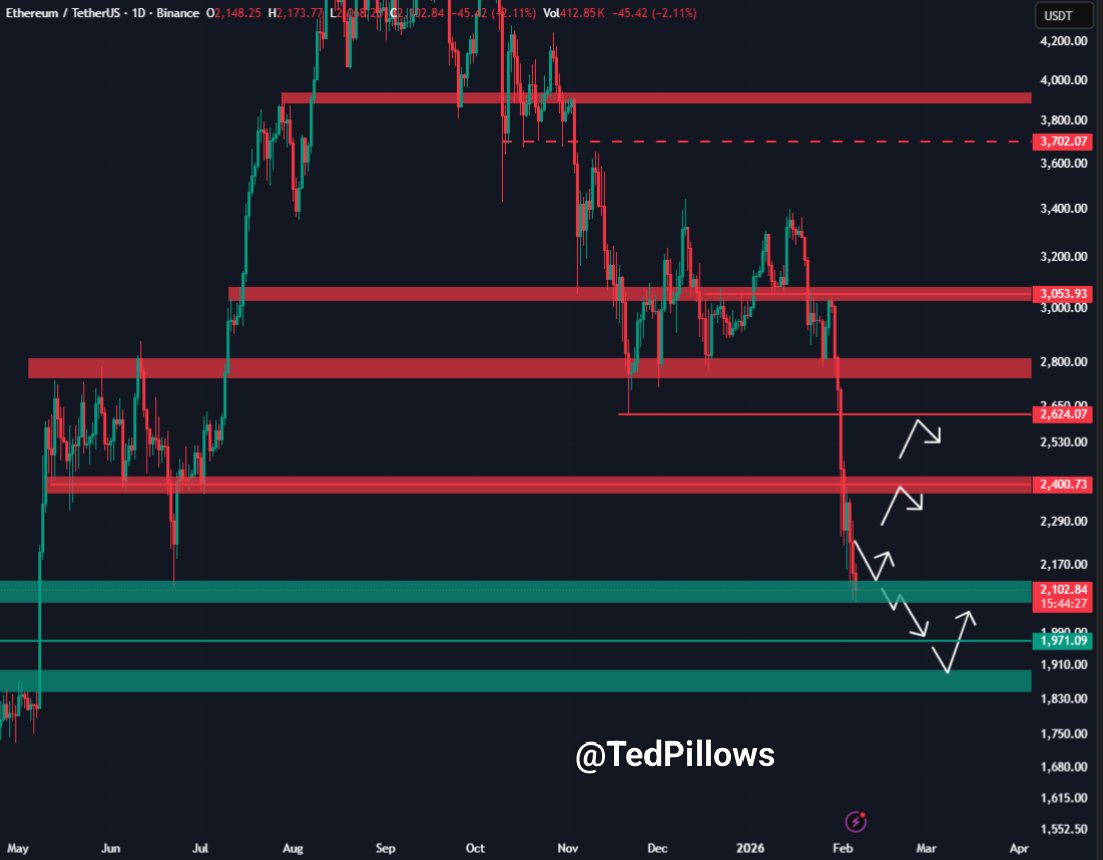
Moreover, the demand zone between $1,900 and $2,000 represents the final major support before a deeper retracement. Price is attempting to stabilize in this zone, but the absence of strong bullish reactions highlights buyer hesitation. This muted response suggests participants remain risk-averse amid broader market weakness.
Structurally, the setup presents a clear binary scenario. Holding the $2,000–$2,100 range could allow Ethereum price to form a temporary base. However, a decisive breakdown would likely accelerate downside momentum, turning former support into resistance and confirming a deeper corrective phase.
Ethereum Price Confirms Bear Flag Breakdown
Furthermore, analyst Trader Tardigrade’s 3-day ETH against USD chart identifies a textbook bear flag formation. After a steep impulsive decline, Ethereum consolidated within an upward-sloping channel, forming the flag structure. The recent breakdown below this channel confirms bearish continuation in line with the prevailing trend.

Momentum characteristics support this view. The breakdown candle is decisive, showing strong follow-through without immediate recovery. This behavior indicates that sellers remain firmly in control, limiting the probability of a near-term trend reversal.
Based on the measured move of the flagpole, Trader Tardigrade highlights $1,666 as the primary downside target. Unless Ethereum price can quickly reclaim the former flag range, any short-term bounces are likely corrective. From a higher-timeframe perspective, the pattern reinforces that the broader downtrend remains intact.
The post Ethereum Price Outlook: Bearish Structure Puts $1,666 ETH Target in Play appeared first on CoinCentral.
You May Also Like

Top NYC Book Publishing Companies

Sensorion Announces its Participation in the Association for Research in Otolaryngology ARO 49th Annual Midwinter Meeting
