

Bitcoin Price Hits Barriers, Can Bulls Overcome Key Resistance Levels?
Bitcoin price started a recovery wave above $70,000. BTC is now consolidating above $70,200 and might aim for a steady increase if it clears $71,650.
- Bitcoin started a decent recovery wave above $69,800 and $70,200.
- The price is trading above $70,200 and the 100 hourly simple moving average.
- There is a bullish trend line forming with support at $70,400 on the hourly chart of the BTC/USD pair (data feed from Kraken).
- The pair might start another decline if it stays below the $71,000 and $71,650 levels.
Bitcoin Price Faces Hurdles
Bitcoin price started a recovery wave above the $69,5500 resistance level. BTC climbed above the $70,200 and $70,500 resistance levels.
The price even spiked above the 50% Fib retracement level of the downward move from the $75,998 swing high to the $67,342 low. The price even climbed toward the $72,000 zone before the bears took a stand and protected more gains.
Bitcoin is now trading above $70,200 and the 100 hourly simple moving average. There is also a bullish trend line forming with support at $70,400 on the hourly chart of the BTC/USD pair.
If the price remains stable above $70,200, it could attempt a fresh increase. Immediate resistance is near the $71,200 level. The first key resistance is near the $71,650 level. A close above the $71,650 resistance might send the price further higher.
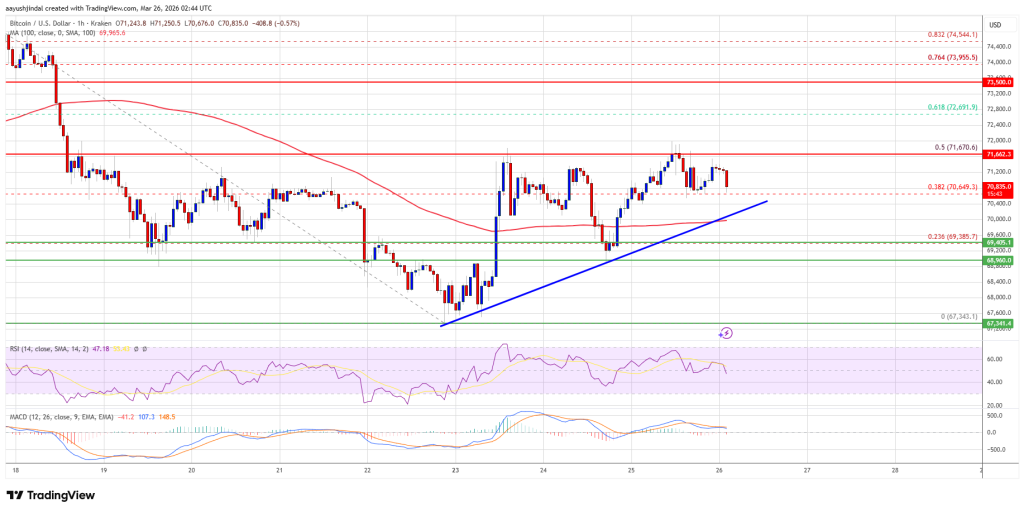
In the stated case, the price could rise and test the $72,650 resistance or the 61.8% Fib retracement level of the downward move from the $75,998 swing high to the $67,342 low. Any more gains might send the price toward the $73,200 level. The next barrier for the bulls could be $73,500.
Another Decline In BTC?
If Bitcoin fails to rise above the $71,650 resistance zone, it could start another decline. Immediate support is near the $70,400 level. The first major support is near the $70,000 level.
The next support is now near the $69,200 zone. Any more losses might send the price toward the $68,800 support in the near term. The main support now sits at $67,500, below which BTC might struggle to recover in the near term.
Technical indicators:
Hourly MACD – The MACD is now losing pace in the bullish zone.
Hourly RSI (Relative Strength Index) – The RSI for BTC/USD is now below the 50 level.
Major Support Levels – $70,000, followed by $69,200.
Major Resistance Levels – $71,200 and $71,650.
You May Also Like

TBC Bank Chooses GDS Link to Power Credit Decisioning for Retail Lending

SOL Price Prediction: Solana Eyes $95 Breakout Despite Current Consolidation


