

Chainlink Shows Early Bullish Signals—Can LINK Price Climb Back to $11 This Month?

The post Chainlink Shows Early Bullish Signals—Can LINK Price Climb Back to $11 This Month? appeared first on Coinpedia Fintech News
Chainlink has historically been known for delivering explosive rallies after extended periods of consolidation. During the previous major breakout cycle, the LINK price surged by more than 310% after escaping a prolonged accumulation range and maintained a strong bullish trend for over a year. Now, the token appears to be forming a remarkably similar structure once again. After spending months trading within a compressed range, LINK is attempting to reclaim key resistance levels while maintaining a bullish higher-low pattern.
At the same time, strengthening ecosystem fundamentals, growing CCIP adoption, and rising market confidence around Chainlink’s infrastructure dominance continue supporting the broader bullish outlook. However, LINK still faces a crucial resistance barrier near the $11 zone, which previously acted as a major rejection area. The key question now is whether Chainlink can finally break above this critical level and confirm the beginning of a larger bullish expansion phase in the coming weeks.
LINK Price Attempts Breakout From Key Resistance Zone
The latest daily chart suggests Chainlink is gradually building bullish momentum after defending the ascending support trendline that has remained intact since April. LINK recently witnessed a pullback after facing rejection near the $10.7 resistance zone but continues holding above the crucial $9.7 to $9.8 support range.
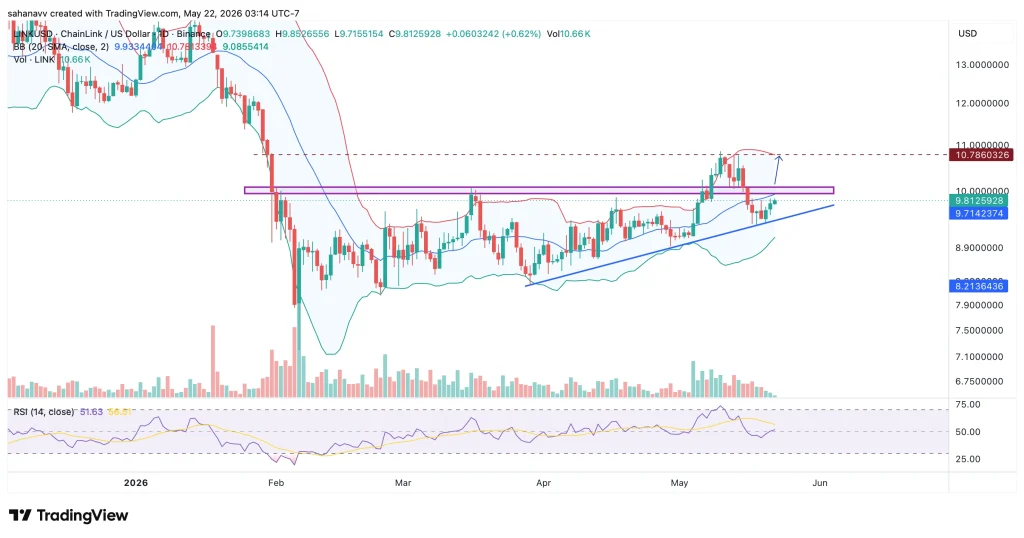
The Bollinger Bands are also beginning to tighten, indicating growing price compression as volatility declines. At the same time, the RSI continues to hold above the neutral 50 level despite the recent pullback, indicating bullish momentum remains relatively stable. The formation of higher lows further suggests buyers continue accumulating during dips instead of allowing a deeper breakdown. If LINK manages to reclaim the overhead resistance zone around $10 and flips it into support, the token could gain enough momentum to challenge the next major resistance near $10.7 and eventually the psychological $11 level.
Chainlink’s Expanding Ecosystem Strengthens the Bullish Outlook
Beyond improving the technical structure, Chainlink’s broader ecosystem growth continues to reinforce long-term bullish sentiment around LINK. Industry estimates suggest Chainlink’s total value secured across multiple blockchain ecosystems has now moved beyond the broader $100 billion range. Alongside, the platform adds another 123,777 LINK worth nearly $1.1M, bringing the total holdings to 3,779,076 LINK.
At the same time, the absence of major ETF-related outflows around Chainlink-linked products indicates that institutional sentiment has remained relatively stable despite broader market volatility. The combination of all these suggests Chainlink’s current consolidation phase may be building the foundation for a larger expansion move if the price successfully reclaims the key $11 resistance zone.
What’s Next for LINK Price?
Chainlink currently remains positioned near a crucial technical zone that could determine the next major directional move. For now, Chainlink appears to be building pressure beneath a critical resistance zone while maintaining a steadily improving technical structure.
If bulls successfully reclaim the $10 resistance range and push LINK above the recent highs near $10.7, the token could quickly gain momentum toward the $11 breakout level. A successful breakout above this range may further open the doors for an extended rally toward $12 and potentially $13.50 in the coming weeks.
On the downside, failure to sustain above the ascending support structure could weaken bullish momentum and expose LINK to a deeper retracement toward the support zones around $9 and $8.2.


추천 콘텐츠

Moody’s Assigns First-Ever Rating to Bitcoin-Backed Municipal Bond in Historic Crypto Finance Move

Hyperliquid Faces Perpetual Futures Test From OKX And NYSE’s Parent Company

How Air Freight Helps Businesses Avoid Costly Downtime When Critical Parts Are Delayed


인기 뉴스
더보기
