

Bitcoin Price Prediction: Will BTC Stay Stuck in Consolidation Through the Weekend?
Bitcoin is trading at $77.3k to close out the week, locked in a consolidation that has now been running for nearly two weeks around the $75k–$80k range. The ascending channel from February is intact, the short-term support zone at $75k is holding, and the funding rates are positive again. This shows a market that is neither panicking nor rushing. What is building beneath the surface may matter more than what the price chart is showing.
Bitcoin Price Analysis: The Daily Chart
On the daily timeframe, the ascending channel continues to provide the macro framework, with the lower boundary rising toward $72k and the 100-day moving average also rising just above the same zone.
These two dynamic support elements are located closely and create a strengthening combined floor that closes in on the price every week. The asset has held above the $75k demand zone after getting tested in the past week, and the RSI has stabilized around 50, neither building momentum nor losing it.
The path forward requires a daily close above $80k and the declining 200-day moving average nearby, to build a bullish case again. Below, the support zone at $75k is the immediate support that could still get broken to the downside, which would then open the path toward the 100-day moving average and the lower boundary of the channel.
Ultimately, a daily close below $72k would be a significant structural damage that could put the entire recovery case in jeopardy, and would put the $60 demand zone back in scope.
BTC/USDT 4-Hour Chart
On the 4-hour chart, the price has bounced from the $75k–$76k order block and is now consolidating directly below the recent structural lower high at $78.2k. The RSI on this timeframe has also recovered from near oversold levels that were reached during the recent sell-off to the mid-50s. This suggests that the bounce has legs without yet generating the momentum needed to clear the resistance above.
The ascending daily channel’s structure is clean, with the floor located at $70k and the upper boundary is now around $83k, where the next critical resistance zone also sits.
A 4-hour close above $78k would be the first confirmation that the price is rebounding, with the bearish Fair Value Gap zone around $80k as the next area to fill before targeting the channel’s ceiling. Yet, failure to clear $78k and a drop below $75k could lead to a further decline toward the key $72k area in the coming weeks.
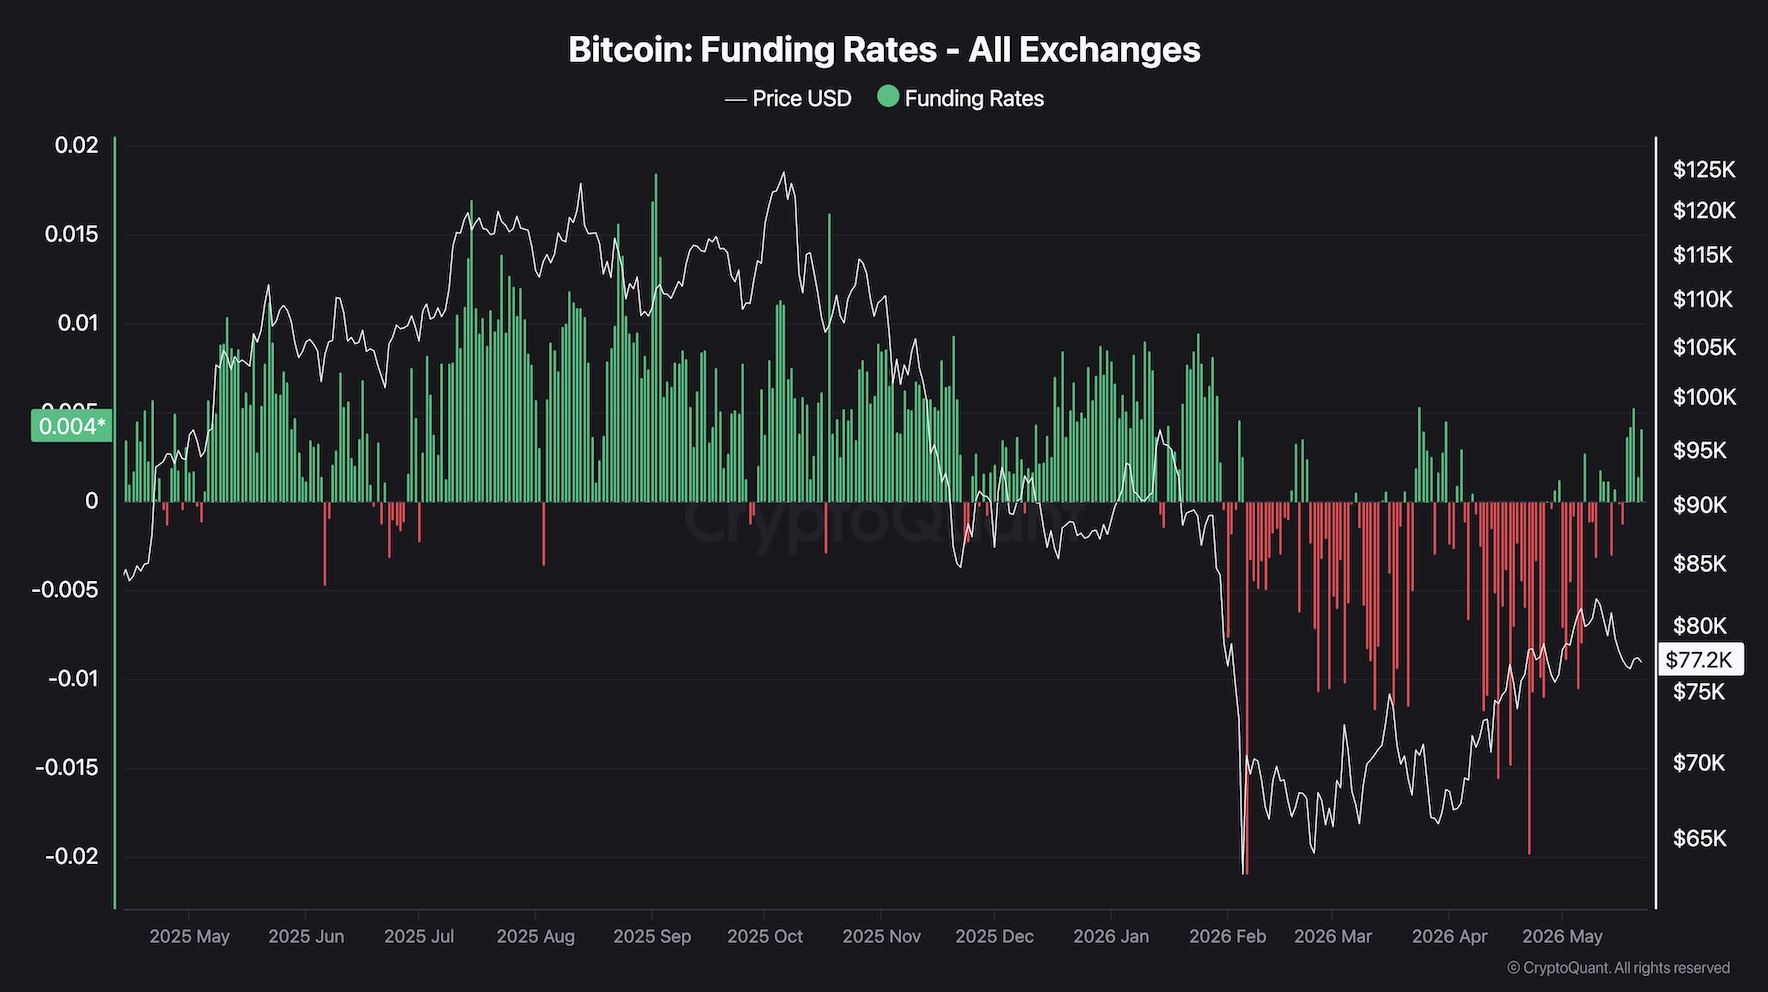
Sentiment Analysis
The funding rates have returned to a modest +0.004 after oscillating between slightly negative and slightly positive for the past two weeks. The important development is not the current reading in isolation but what it represents in context.
The deeply negative funding that powered the $60k to $80k recovery by providing constant short-squeeze fuel for every upward leg has been largely exhausted. The most recent negative bars have also been shallow, compared to the extremes of February and April.
What this means practically is that the $75k support is holding without the assistance of forced short liquidations, driving the bounce. That is a more credible test of support than anything seen during the short-squeeze-dominated rally. The level is being defended by buyers who are choosing to buy, not by shorts being forced to cover.
If funding oscillates near zero or remains modestly positive as price attempts to reclaim $80k, it would signal that organic long demand is beginning to replace short-squeeze mechanics as the driver, and historically, that transition has marked the point where recoveries become sustainable.
 Screenshot
The post Bitcoin Price Prediction: Will BTC Stay Stuck in Consolidation Through the Weekend? appeared first on CryptoPotato.


추천 콘텐츠

Moody’s Assigns First-Ever Rating to Bitcoin-Backed Municipal Bond in Historic Crypto Finance Move

Hyperliquid Faces Perpetual Futures Test From OKX And NYSE’s Parent Company

How Air Freight Helps Businesses Avoid Costly Downtime When Critical Parts Are Delayed


인기 뉴스
더보기
