Understanding Depth Charts
1. What Is a Depth Chart?
2. Basic Components of a Depth Chart
- Horizontal axis (X-axis): Shows order prices, increasing from left to right, and reflects the overall price range in the market.
- Vertical axis (Y-axis): Indicates the order quantity, i.e., the total number of buy or sell orders placed at each price level.
- Green area: Represents the buy side (bids), or the collection of orders willing to purchase at the current price or lower. A larger green area indicates stronger buying pressure.
- Red area: Represents the sell side (asks), or the collection of orders willing to sell at the current price or higher. A larger red area indicates stronger selling pressure.
- Intersection point: Marks the current market price, where buying and selling forces are balanced.
- Price range: Reflects the span of price fluctuations, indicating how much price movement the market is willing to accept.
3. How to Read a Depth Chart
3.1 Assessing Market Depth
- Dense order book with tight spreads: If buy and sell orders are layered closely together at multiple price levels, it indicates better market depth. This means many orders are concentrated near the current price, allowing traders to execute transactions closer to market value and reduce trading costs.
- Thin order book with wide gaps: Conversely, if there are large gaps between order levels, it suggests poor market depth. This indicates fewer orders at certain price levels, so traders may face wider spreads and greater price slippage when executing market orders, leading to higher trading costs.
3.2 Understanding the Balance of Buying and Selling Pressure
- Larger green area: Indicates stronger buying pressure, suggesting the market may be trending upward.
- Larger red area: Indicates stronger selling pressure, suggesting the market may be trending downward.
- Similar areas: Indicates a balance between buyers and sellers, suggesting the market may be in a consolidation phase.
3.3 Example: Interpreting a BTC Depth Chart
4. Three Key Benefits of Understanding Depth Charts
- Lower trading costs: A market with strong depth means a larger number of orders, allowing traders to buy or sell at prices closer to the actual market level, thereby reducing transaction costs.
- Avoid slippage: In markets with poor depth, there may be a large gap between the order price and the actual filled price, leading to slippage. By analyzing the depth chart, traders can anticipate market depth conditions in advance and avoid trading in conditions with high slippage risk.
- Formulate trading strategies: By combining depth chart analysis with the comparison of buying and selling pressure, traders can design more precise strategies. For example, in markets with stronger buying pressure, buying on dips may be favorable; in markets with stronger selling pressure, selling on rallies may be more appropriate.
5. Conclusion
Recommended Reading:
- Why Choose MEXC Futures? Gain deeper insight into the advantages and unique features of MEXC Futures to help you stay ahead in the market.
- MEXC Futures Trading Tutorial (App) Understand the full process of trading Futures on the app and get started with ease.
Popular Articles
View More
Strategy CEO Says Bitcoin Sales Are Possible as MSTR Rethinks Treasury Playbook
Key Takeaways Strategy CEO Phong Le said the company may sell Bitcoin in specific cases. Sales could be used to fund preferred-stock dividends or offset taxes. The company says any sale must be

MEXC Alpha Trader Research Weekly | BTC Holds Firm Above $80K as Crypto Regulation Reaches a Historic Turning Point
Week 1 of May 2026 Reporting Period: April 28 – May 5, 2026 Data Cutoff: May 5, 2026 Core Narrative Over the past week, the crypto market’s primary driver underwent a major shift — the macro

BTC Price Prediction May 2026: Can BTC Hold $81K and Push Toward $100K?
Bitcoin just crossed $81,000 — its highest level since January — and the move is turning heads across the crypto market. This isn't just another price spike. Behind this rally are real structural

Does Viagogo Accept Bitcoin? Complete Guide to Buying Atlético Madrid vs Arsenal 2026 Champions League Tickets with BTC
Key Takeaways Match Information: Atlético Madrid will face Arsenal Football Club on April 29, 2026, at 21:00 local time (UTC+2) in the first leg of the Champions League semi-final Viagogo Payment
Hot Crypto Updates
View More
Can You Buy a Used Tesla with Bitcoin? A Comprehensive Guide to BTC Vehicle Purchases in 2026
Key Takeaways Direct BTC Purchases: Purchasing a used Tesla directly with Bitcoin remains uncommon in 2026, as most dealerships and private sellers prefer traditional payment methods or require

Stop Holding Idle BTC: Comparing Real Yield Opportunities on Bitcoin L2s
Your BTC sitting idle in a cold wallet? This deep-dive compares real yield opportunities across leading Bitcoin L2s — Stacks, Rootstock, Merlin Chain and more — so you can put your Bitcoin to work


Trending News
View More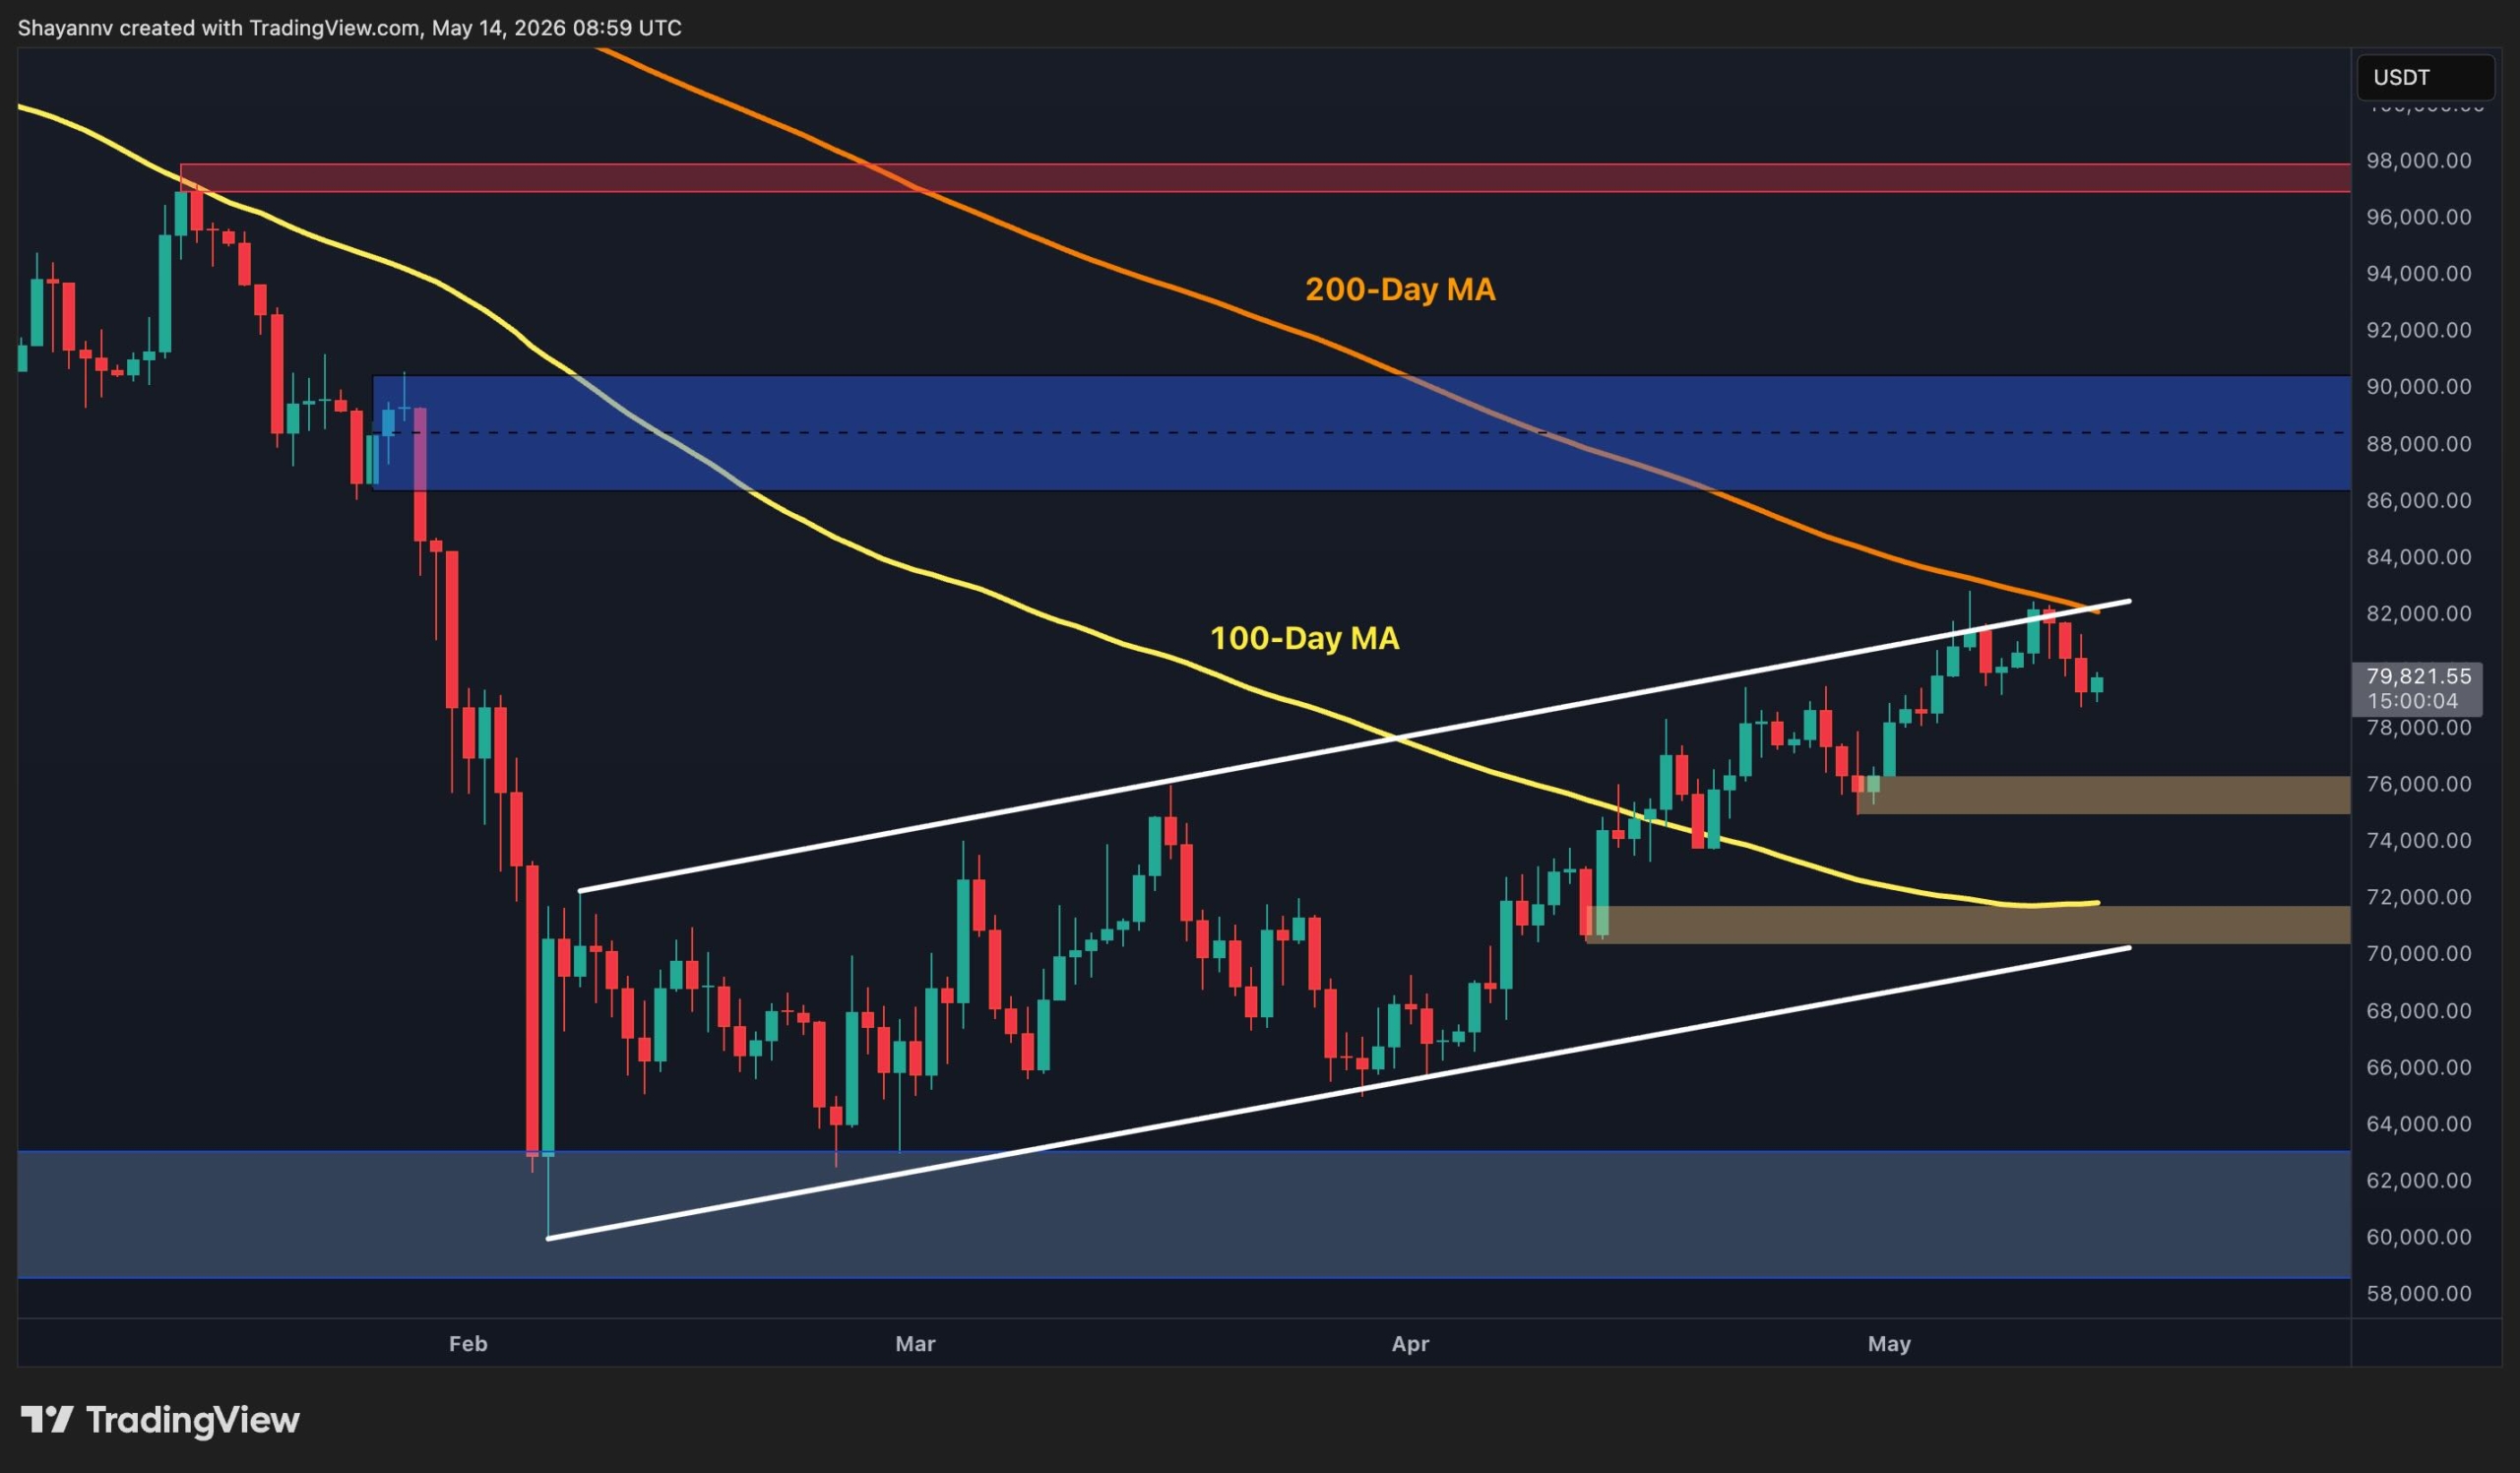
Bitcoin Price Prediction: BTC Risks Drop to $75K as Sellers Defend Critical $80K Resistance
Bitcoin has started showing early signs of weakness after its recent recovery rally toward the $80K resistance region. The market is now confronting a technically
JPMorgan: Altcoin Weakness Against Bitcoin Is Here to Stay
BitcoinWorld JPMorgan: Altcoin Weakness Against Bitcoin Is Here to Stay JPMorgan has released a sobering analysis for altcoin investors: the prolonged underperformance


Related Articles
View More
Fully understand the MEXC perpetual futures trading model to help you better formulate trading strategies
MEXC provides traders with flexible options. Users can choose between U-based or Coin-M perpetual futures according to their personal preferences. At the same time, MEXC supports one-way and two-way p
Why Choose MEXC Futures?
Cryptocurrency futures trading has attracted countless investors with its promise of high leverage and high returns. Choosing the right exchange is the first step on the journey to successful futures
What Are Prediction Futures?
Cryptocurrency futures trading attracts countless investors with its high leverage and the ability to profit in both rising and falling markets. However, its complex mechanisms such as margin, leverag