Pinterest Stock Hugs Lower Band as $18.55 Support Comes Into View

Pinterest Stock (PINS) remains under pressure near $18.84, with the daily trend neutral but tilting bearish. Price sits below the 20- and 50-day EMAs and hugs the lower Bollinger Band. Therefore, the base case is a choppy, downside-leaning range unless buyers reclaim nearby levels.
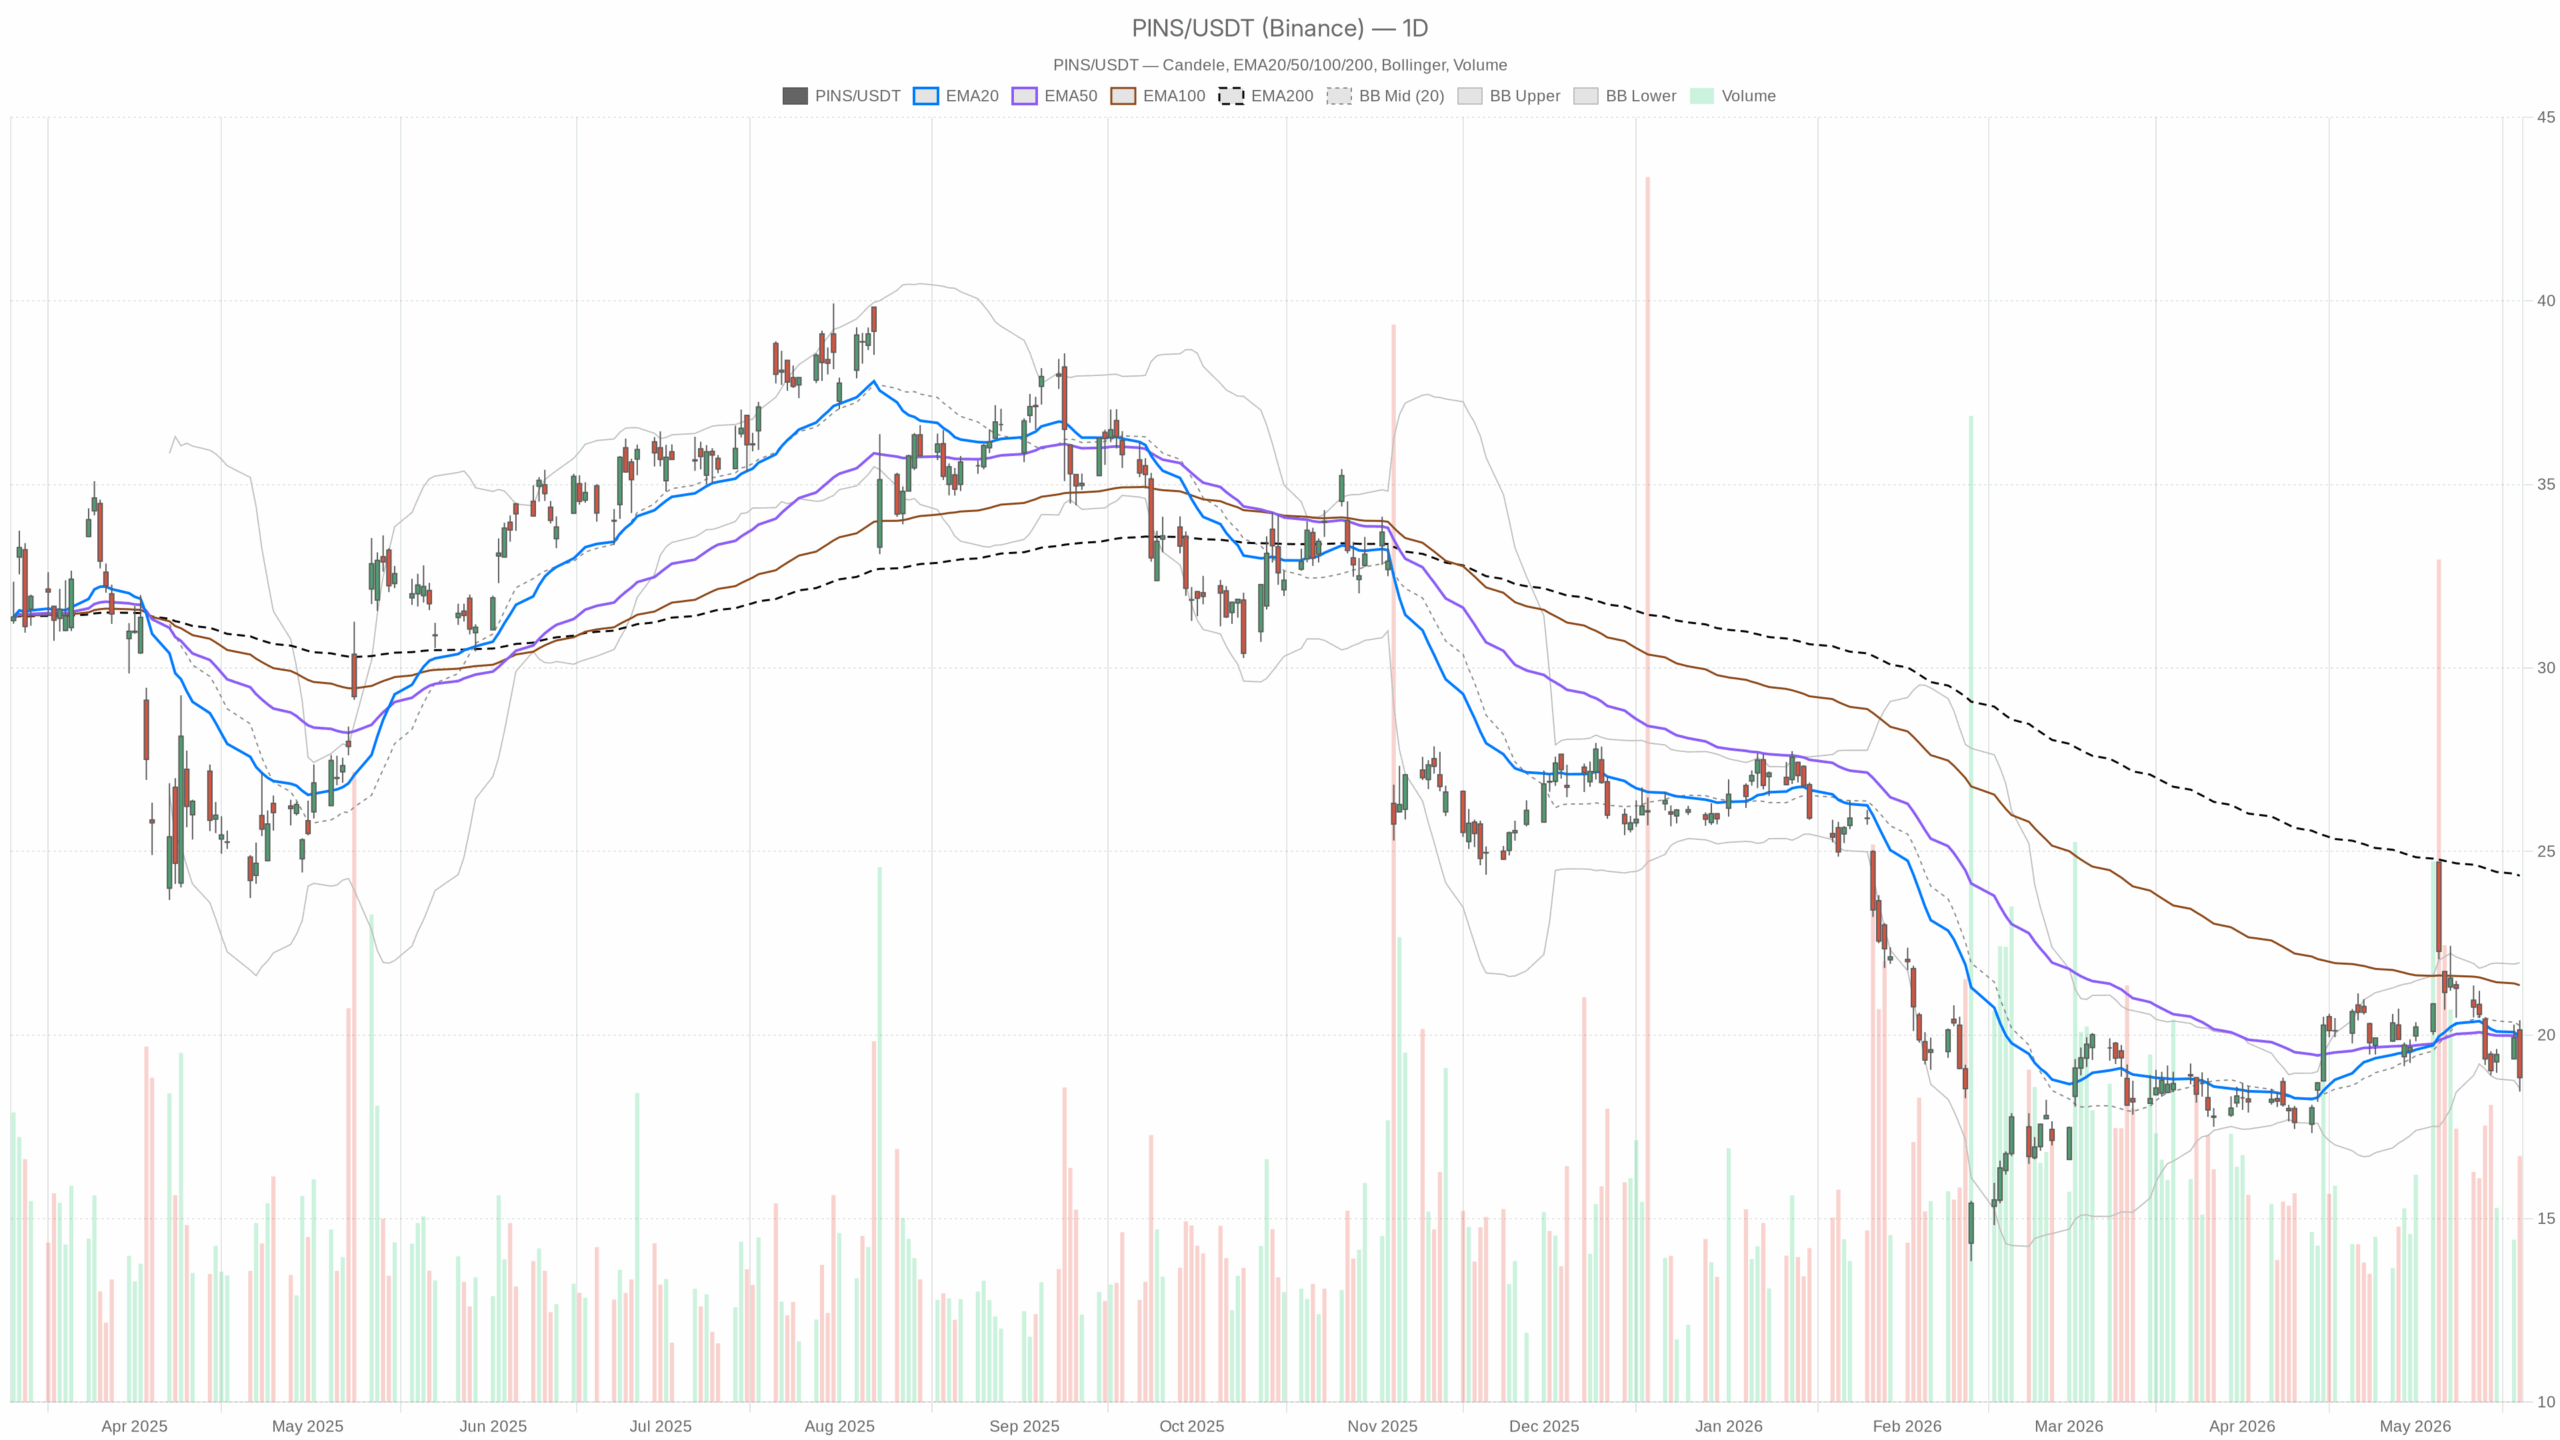 PINS — daily chart with candlesticks, EMA20/EMA50 and volume.
Pinterest Stock daily trend and EMAs
On the daily chart, PINS closed at $18.84 versus the 20-day EMA at $19.96 and the 50-day EMA at $19.94. Trading below both short- and medium-term EMAs signals trend weakness. Sellers still control the slope. Meanwhile, the 200-day EMA stands much higher at $24.34, keeping the longer-term trend damaged and rallies capped by overhead supply.
Momentum and breadth signals
Daily RSI(14) prints 42.29. Momentum is bearish but not washed out, leaving room for another push lower before dip-buyers get active. In addition, Daily MACD shows line 0.01 vs signal 0.27 with a -0.25 histogram. Negative breadth confirms downside pressure remains present.
Volatility, bands, and the daily pivot map
Bollinger Bands and ATR
Daily Bollinger Bands show a mid at $20.26 with the lower band at $18.55. Price is riding the lower rail, which often precedes either a continuation drift or a reflex bounce. Meanwhile, Daily ATR(14) is 1.23, implying typical daily swings around $1–$1.25 and keeping short-term risk elevated.
Daily pivots and nearby tests
Daily pivots: PP $19.23, R1 $20.01, S1 $18.06. Therefore, $19.23/$20.01 cap the first overhead tests, while $18.06 is the next meaningful support.
1-hour chart: intraday pressure weakens the neutral read
1H trend and momentum
Meanwhile, the 1-hour chart leans more clearly bearish and weakens the daily neutrality. The 1H close is below the 20/50/200 EMAs at $19.35/$19.76/$19.88, pointing to layered resistance above. 1H RSI(14) sits at 38.11, so intraday momentum favors sellers without being oversold. Also, 1H MACD carries a negative histogram at -0.10, keeping the short-term impulse weak.
1H volatility and pivots
On 1H Bollinger, the mid is $19.48 with a lower band near $18.44 and price around $18.84. Price is stabilizing just above the lower band, yet it sits within a bearish volatility envelope. In parallel, 1H ATR(14) is 0.39, so intraday ranges are moderate and allow tests of nearby pivots. 1H pivots: PP $18.81, R1 $18.89, S1 $18.77. The tape is coiling around PP with a tight $18.77–$18.89 micro range.
15-minute execution context
At the same time, the 15-minute view offers execution context, not a signal change. Price sits under the 15m 20/50/200 EMAs at $18.94/$19.27/$19.84, so the micro-trend remains down into resistance layers. 15m RSI(14) is 40.16, which keeps momentum soft but not stretched. The 15m MACD line (-0.23) is just above its signal (-0.27) with a +0.04 histogram, hinting at a shallow, tentative bounce.
Furthermore, 15m Bollinger shows a mid at $18.86 with price near $18.84. Price is hovering around the center line, implying short pauses rather than commitment. In addition, 15m ATR(14) is 0.14, so micro volatility is compressed and can precede a quick directional pop. 15m pivots: PP $18.82, R1 $18.88, S1 $18.78. Immediate inflection sits in a narrow 10-cent band.
Scenarios for PINS
Base case: neutral with a bearish tilt
The daily regime is labeled neutral, but structure and momentum lean lower. A drift toward $18.55 and possibly a probe of $18.06 is plausible if sellers defend $19.23. Failure to reclaim the daily pivot keeps pressure on the downside within a range.
Bullish scenario
A push back above the daily PP at $19.23 and a close above the 20/50-day EMAs near $19.95 would stabilize the tape. Regaining those averages would signal buyers absorbing supply. A daily RSI break above 50 and a MACD histogram turn positive would add confirmation.
On the 1H, reclaiming $19.35–$19.76 and holding over $18.89 intraday R1 would help cement a base. Multiple timeframe alignment would shift bias to constructive.
Bearish scenario
Rejection under $18.89 on 1H followed by a break below $18.78 and then the daily lower band at $18.55 would keep momentum negative. Losing band support often invites continuation. A decisive drop through daily S1 at $18.06 with MACD staying negative would open further downside.
With ATR at 1.23, follow-through could be brisk on a weak day. Volatility would therefore amplify downside moves.
Key levels and overall view for Pinterest Stock
Overall, Pinterest Stock trades in a neutral daily regime with a bearish slant, and the 1H downtrend corroborates the pressure. Until price retakes $19.23 and then the $20 handle, volatility favors two-sided action with downside risk. Notably, key references are $18.55/$18.06 on support and $19.23/$20.01 on resistance as the market searches for direction.


You May Also Like

How Stablecoins Are Changing Business Payments

Lowe’s (LOW) Stock Falls After Earnings Beat Gets Overshadowed by Weak Guidance