Bitcoin price attempted to start a fresh increase but failed at $89,500. BTC is now struggling below $86,500 and might continue to move down. Bitcoin started a Bitcoin price attempted to start a fresh increase but failed at $89,500. BTC is now struggling below $86,500 and might continue to move down. Bitcoin started a

Bitcoin Price Retests Support—Is the Market Bracing for Volatility?

2025/12/19 10:30

Bitcoin price attempted to start a fresh increase but failed at $89,500. BTC is now struggling below $86,500 and might continue to move down.

  • Bitcoin started a fresh decline below the $86,500 zone.
  • The price is trading below $86,500 and the 100 hourly Simple moving average.
  • There was a break below a bullish trend line with support at $87,250 on the hourly chart of the BTC/USD pair (data feed from Kraken).
  • The pair might continue to move down if it settles below the $85,000 zone.

Bitcoin Price Dips Again

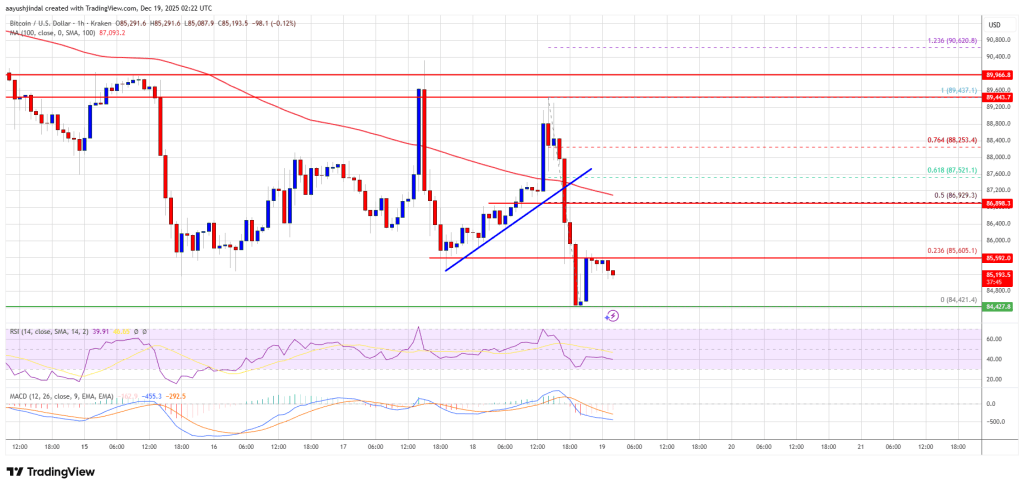
Bitcoin price attempted a fresh recovery wave above $88,000 and $88,500. BTC tested the $89,500 resistance zone and reacted to the downside. There was a sharp decline below $88,000.

There was a break below a bullish trend line with support at $87,250 on the hourly chart of the BTC/USD pair. The price even spiked below the $85,000 support. However, the bulls were active near the $84,500 zone. A low was formed at $84,421 and the price is now consolidating losses below the 23.6% Fib retracement level of the downward move from the $89,437 swing high to the $84,421 low.

Bitcoin is now trading below $87,000 and the 100 hourly Simple moving average. If the bulls remain in action, the price could attempt more gains. Immediate resistance is near the $86,600 level. The first key resistance is near the $87,000 level and the 50% Fib retracement level of the downward move from the $89,437 swing high to the $84,421 low.

Bitcoin Price

The next resistance could be $88,000. A close above the $88,000 resistance might send the price further higher. In the stated case, the price could rise and test the $88,800 resistance. Any more gains might send the price toward the $89,500 level. The next barrier for the bulls could be $90,000 and $90,500.

More Losses In BTC?

If Bitcoin fails to rise above the $87,000 resistance zone, it could start another decline. Immediate support is near the $85,000 level. The first major support is near the $84,500 level.

The next support is now near the $83,200 zone. Any more losses might send the price toward the $82,500 support in the near term. The main support sits at $80,500, below which BTC might accelerate lower in the near term.

Technical indicators:

Hourly MACD – The MACD is now gaining pace in the bearish zone.

Hourly RSI (Relative Strength Index) – The RSI for BTC/USD is now below the 50 level.

Major Support Levels – $85,000, followed by $84,500.

Major Resistance Levels – $87,000 and $88,000.

Market Opportunity
Bitcoin Logo
Bitcoin Price(BTC)
$88,005.67
$88,005.67$88,005.67
+0.03%
USD
Bitcoin (BTC) Live Price Chart
Disclaimer: The articles reposted on this site are sourced from public platforms and are provided for informational purposes only. They do not necessarily reflect the views of MEXC. All rights remain with the original authors. If you believe any content infringes on third-party rights, please contact service@support.mexc.com for removal. MEXC makes no guarantees regarding the accuracy, completeness, or timeliness of the content and is not responsible for any actions taken based on the information provided. The content does not constitute financial, legal, or other professional advice, nor should it be considered a recommendation or endorsement by MEXC.

You May Also Like

ArtGis Finance Partners with MetaXR to Expand its DeFi Offerings in the Metaverse

ArtGis Finance Partners with MetaXR to Expand its DeFi Offerings in the Metaverse

By using this collaboration, ArtGis utilizes MetaXR’s infrastructure to widen access to its assets and enable its customers to interact with the metaverse.
Share
Blockchainreporter2025/09/18 00:07
MAXI DOGE Holders Diversify into $GGs for Fast-Growth 2025 Crypto Presale Opportunities

MAXI DOGE Holders Diversify into $GGs for Fast-Growth 2025 Crypto Presale Opportunities

Presale crypto tokens have become some of the most active areas in Web3, offering early access to projects that blend culture, finance, and technology. Investors are constantly searching for the best crypto presale to buy right now, comparing new token presales across different niches. MAXI DOGE has gained attention for its meme-driven energy, but early [...] The post MAXI DOGE Holders Diversify into $GGs for Fast-Growth 2025 Crypto Presale Opportunities appeared first on Blockonomi.
Share
Blockonomi2025/09/18 00:00
Edges higher ahead of BoC-Fed policy outcome

Edges higher ahead of BoC-Fed policy outcome

The post Edges higher ahead of BoC-Fed policy outcome appeared on BitcoinEthereumNews.com. USD/CAD gains marginally to near 1.3760 ahead of monetary policy announcements by the Fed and the BoC. Both the Fed and the BoC are expected to lower interest rates. USD/CAD forms a Head and Shoulder chart pattern. The USD/CAD pair ticks up to near 1.3760 during the late European session on Wednesday. The Loonie pair gains marginally ahead of monetary policy outcomes by the Bank of Canada (BoC) and the Federal Reserve (Fed) during New York trading hours. Both the BoC and the Fed are expected to cut interest rates amid mounting labor market conditions in their respective economies. Inflationary pressures in the Canadian economy have cooled down, emerging as another reason behind the BoC’s dovish expectations. However, the Fed is expected to start the monetary-easing campaign despite the United States (US) inflation remaining higher. Investors will closely monitor press conferences from both Fed Chair Jerome Powell and BoC Governor Tiff Macklem to get cues about whether there will be more interest rate cuts in the remainder of the year. According to analysts from Barclays, the Fed’s latest median projections for interest rates are likely to call for three interest rate cuts by 2025. Ahead of the Fed’s monetary policy, the US Dollar Index (DXY), which tracks the Greenback’s value against six major currencies, holds onto Tuesday’s losses near 96.60. USD/CAD forms a Head and Shoulder chart pattern, which indicates a bearish reversal. The neckline of the above-mentioned chart pattern is plotted near 1.3715. The near-term trend of the pair remains bearish as it stays below the 20-day Exponential Moving Average (EMA), which trades around 1.3800. The 14-day Relative Strength Index (RSI) slides to near 40.00. A fresh bearish momentum would emerge if the RSI falls below that level. Going forward, the asset could slide towards the round level of…
Share
BitcoinEthereumNews2025/09/18 01:23