

Bitcoin Flash Crash Wipes Out $128 Million in Long Positions as Price Briefly Dips Below $90,000
Bitcoin (BTC) experienced a brief but sharp flash crash on Thursday, dipping to establish an intra-day low of $89,641 before rebounding above $90,000.
The move highlights continued volatility in the cryptocurrency market, with millions of long positions caught off guard and subsequently wiped out.
Bitcoin Price Briefly Drops Below $90,000, Liquidates $128 Million in Longs
As of this writing, the Bitcoin price was trading at $90,431, having briefly dropped below the $90,000 psychological level.
The last time the pioneer crypto treaded below this threshold was on January 3, the same day it broke above it to the upside, effectively ending a multi-week consolidation.
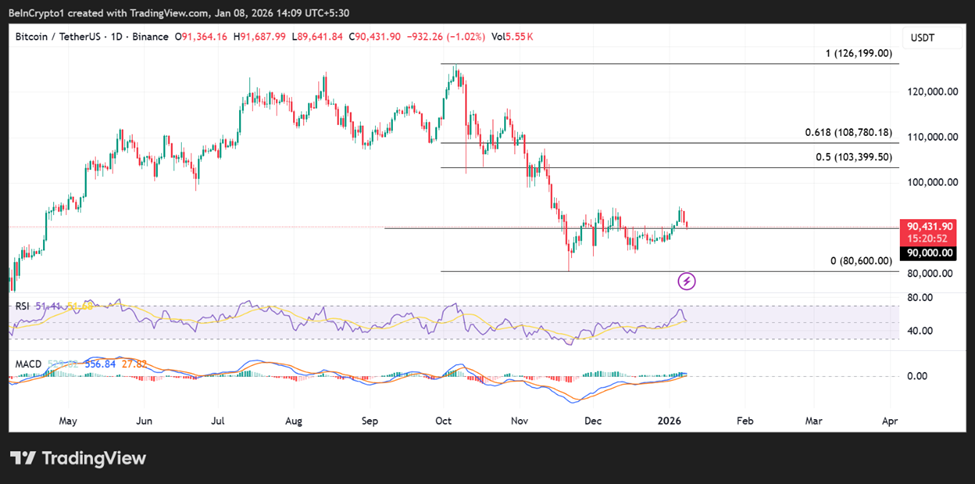 Bitcoin (BTC) Price Performance. Source: TradingView
Several traders were caught off guard, with Coinglass data showing that the move triggered the liquidation of roughly $128 million in long positions. This highlights the risks faced by leveraged traders amid a tight trading range.
The sell-off follows significant outflows from US spot Bitcoin ETFs, with data from SoSoValue showing $486 million in net redemptions (outflows) on Wednesday, marking the largest single-day outflow since November 20.
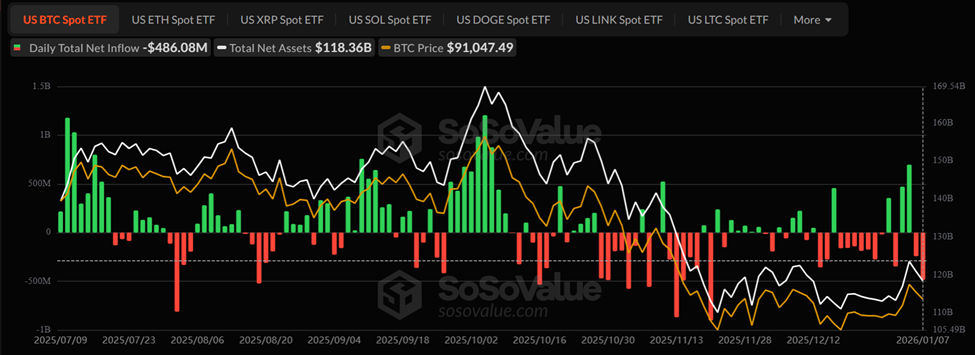 Bitcoin ETF Flows. Source: SoSoValue
ETF fund flows had already turned negative on Tuesday, with $243 million exiting during the session, following a strong start to the year. It marks a strong turnaround from the $697 million in positive flows recorded on Monday.
This demonstrates how Bitcoin’s price in recent days has closely tracked ETF activity, highlighting the influence of institutional investment products on the market.
Mechanical Constraints and Low Volume Keep Bitcoin Below $100,000
Despite the volatility, some analysts caution against reading weakness into Bitcoin’s price action.
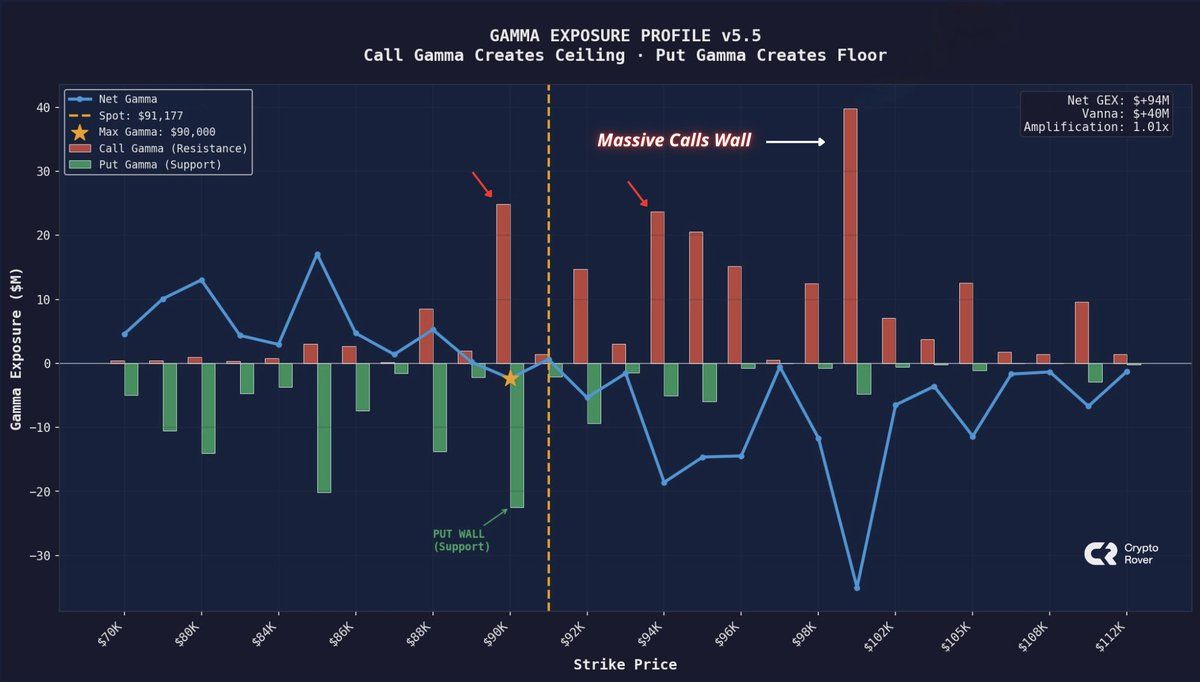 Gamma exposure profile showing Bitcoin’s $90K support and $100K resistance. Source: Crypto Rover
According to Rover, things are bound to change as the month progresses, with expiring options later in the month expected to influence prices. Bitcoin could see an earlier breakout if institutional demand returns to the market.
CryptoQuant CEO Ki Young Ju echoed this perspective, emphasizing structural shifts in market liquidity. According to Ki, capital inflows into Bitcoin have dried up, with liquidity channels now more diverse, rendering timing inflows as pointless.
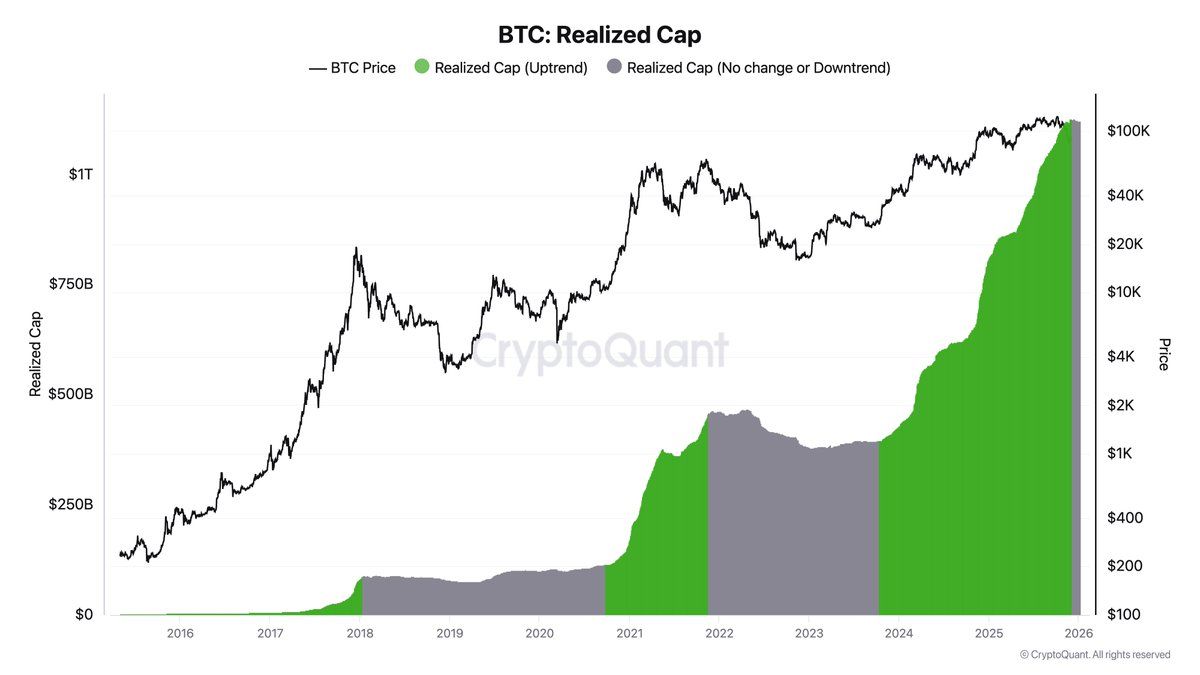 Bitcoin realized cap near $1 trillion showing structural market strength. Source: Ki Young Ju
On-chain activity remains muted, according to CryptoQuant analyst Cauê Oliveira. According to the analyst, trading volumes and movement have yet to recover to levels sufficient to support a sustained rally toward $100,000.
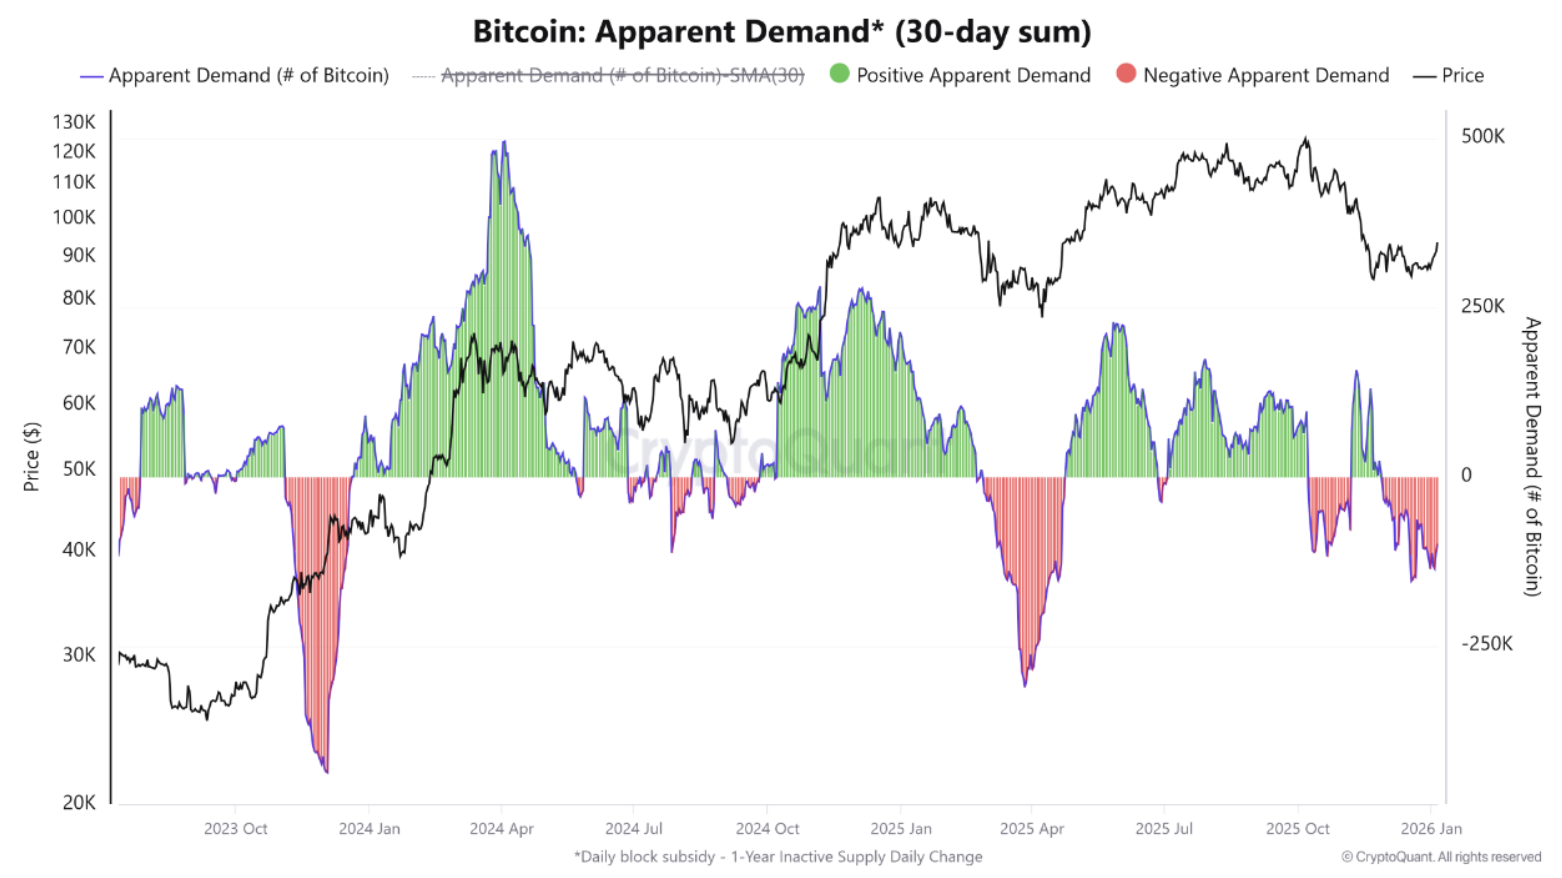 Bitcoin Apparent Demand. Source: CryptoQuant
Analysts also point to broader macro factors as potential catalysts for Bitcoin. If geopolitical developments, such as changes around Venezuela, result in lower oil prices, it could reduce inflationary pressure and lower mining costs. This could create a more supportive backdrop for BTC.
Bitcoin is expected to remain range-bound between $90,000 and $95,000 in the near term. This is amid the absence of renewed institutional inflows or macroeconomic tailwinds.
Thursday’s flash crash illustrates the ongoing tension between institutional hedging, retail positioning, and macroeconomic factors in shaping Bitcoin’s price.
The $100,000 level remains the psychological and technical target for many traders. Still, experts agree that time and market structure will dictate the next meaningful breakout. Now, mid-to-late January options expiries emerges as a potential trigger.
You May Also Like

OKX launches RIVERUSDT perpetual contracts

Will XRP Price Increase In September 2025?
