

XRP Price to $27? This Chart Shows a Full Macro Reversal Setup
A new chart shared by top analyst ChartNerdTA is making the rounds because it shows a possible path for the XRP price toward $27. What stands out is not the number itself, but the long-term structure behind it.
This is not about a quick pump. It is about whether XRP could finally be changing its long-term trend after years of moving sideways and failing to hold rallies.
The chart highlights a large structure that has been built over multiple years. The XRP price spent a long time moving sideways after its major peak, with repeated failed attempts to break higher.
The thing that stands out right now, however, is that the price did not only pierce through the prior zone, acting as resistance, but instead, proceeded to hold up in this zone.
This behavior often suggests that the market is trying to turn old resistance levels into new support levels, and this is possibly the strongest indication that we can see of a trend change in the market at higher timeframes.
Read Also: Silver Price Hits $108 as Mining Stocks Enter a Cash Flow Boom
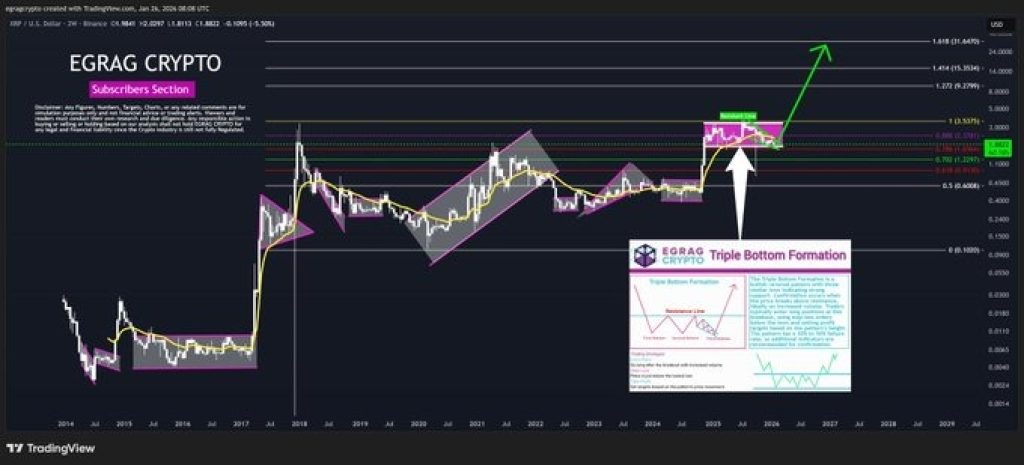 Source: X/ChartNerdTA
Why this Matters For XRP on a Macro Level
For most of its recent history, the XRP price has remained trapped below major resistance zones, unable to sustain any breakout attempts. Each rally eventually faded and price returned to the same range.
Now, the chart suggests that XRP may be breaking that pattern. Holding above long-term resistance changes the structure from neutral or bearish into something more constructive.
This does not guarantee a move to $27, but it does suggest that the market is treating XRP differently than it did in previous cycles.
Where the $27 target comes from For XRP
The $27 level shown on the chart is not random. It is based on projecting the size of the current structure into a potential future move, similar to how large breakouts were measured in earlier crypto cycles.
In simple terms, if the XRP price truly breaks out of its long-term range and enters a new expansion phase, targets above the previous all-time high come into play. The $27 zone represents the upper boundary of that projected move.
That does not mean price moves there in a straight line or quickly. It would likely take multiple phases, with pullbacks and consolidations along the way.
Here’s What needs to happen first
Before any talk of $27 becomes realistic, XRP must first hold its current range and continue to build support above the key breakout area.
The most important thing right now is not the final target, but whether the XRP price continues to respect this new structure. If XRP drops back below the breakout zone and fails to recover it, the macro setup would weaken significantly.
On the other hand, continued consolidation above this area followed by a clean move higher would strengthen the case that a larger trend shift is underway.
Subscribe to our YouTube channel for daily crypto updates, market insights, and expert analysis.
The post XRP Price to $27? This Chart Shows a Full Macro Reversal Setup appeared first on CaptainAltcoin.
You May Also Like

What is the 12 20 80 rule? A practical guide for new managers

Unleashing A New Era Of Seller Empowerment
