

Bitcoin Deleveraging Finally Over? What The Derivatives Data Says
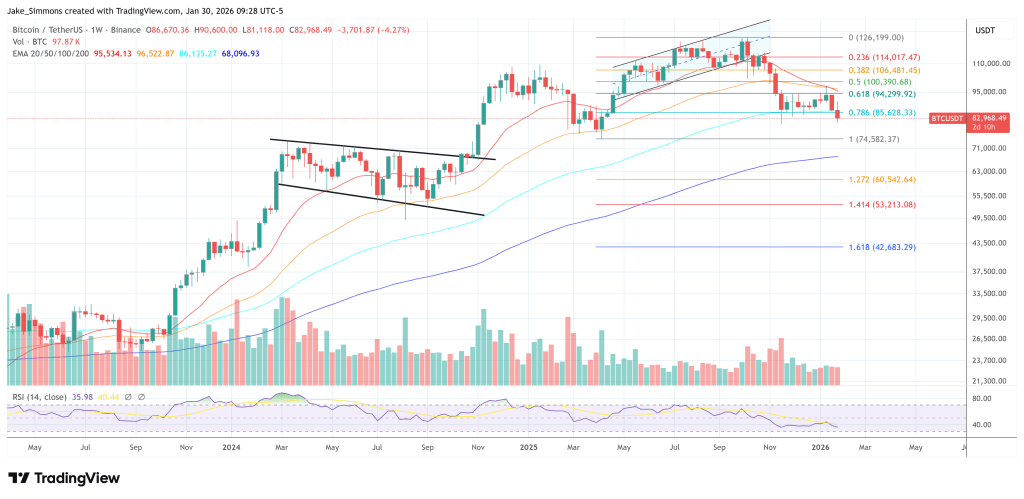
Bitcoin’s sharp slide to $81,119 on January 30 came with a derivatives-market gut punch: forced long closures spiked to extreme levels, yet perpetual funding stayed decisively positive. That mix is complicating a common read, whether the market has already “cleansed” leverage or is still set up for repeat liquidation waves.
Is The Bitcoin Deleveraging Over?
On-Chain analyst Axel Adler Jr., in his Morning Brief, pointed to a “cascade of forced closures” over the past 24 hours, with long liquidations dominating the tape. His liquidation dominance oscillator tracking the balance of long versus short liquidations, printed roughly 97%, while the 30-day moving average rose to 31.4%. In plain market-structure terms, that says deleveraging pressure has been heavily one-sided, not just on the day but as a sustained pattern through the last month.
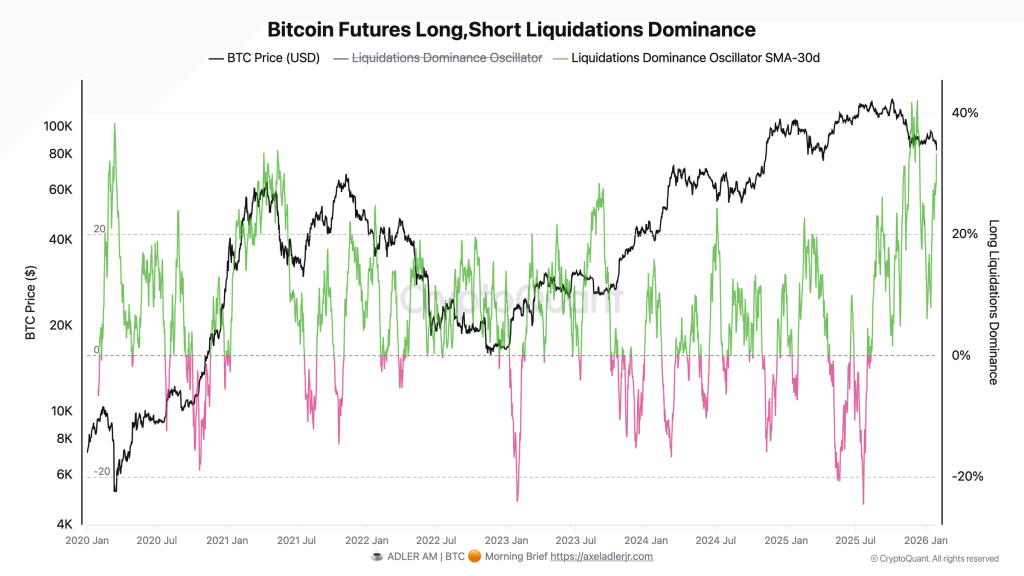
The reason traders watch extremes like this is the tendency for liquidation flows to cluster and then fade, creating room for near-term stabilization. Adler framed that dynamic cautiously, stressing that an “extreme” reading is not the same thing as confirmation that sellers are done.
That sets the first condition for calling the deleveraging cycle “over”: the liquidation imbalance has to cool, rather than simply peak.
The bigger tension in Adler’s read is that even after the washout in price and the liquidation cascade, funding remained positive: 43.2% annualized on the day, by his figures. While that’s well below the 100%+ annualized levels seen during October–November peaks, it still implies a market paying to stay long rather than getting paid to short.
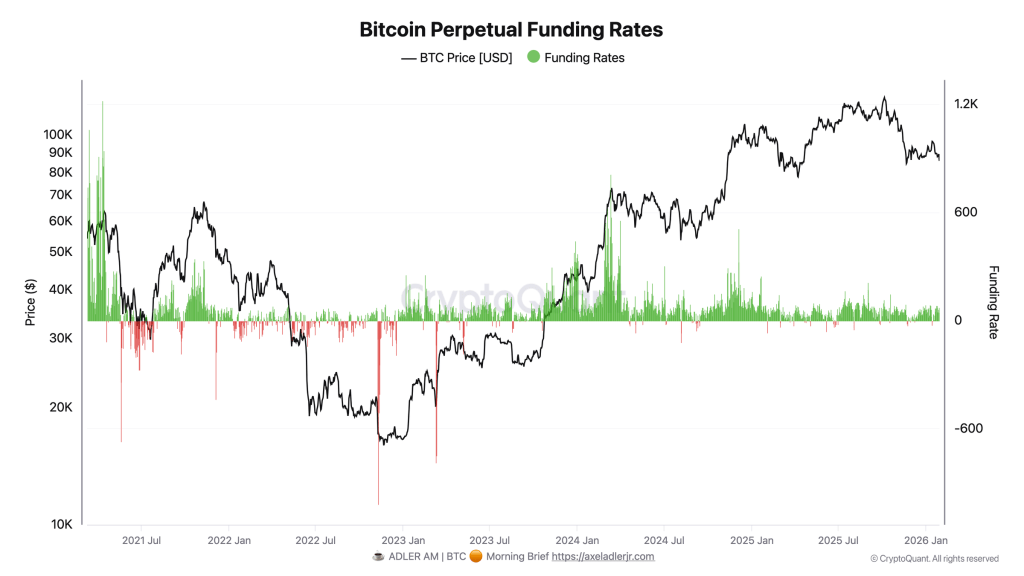
Funding doesn’t just reflect sentiment; it reflects positioning pressure. If funding refuses to flip despite a selloff, it can mean longs are rebuilding exposure quickly, or that the market never fully unwound bullish leverage in the first place. Adler’s conclusion is that the latter risk is still on the table.
In other words, the liquidation event may have been violent, but the incentives embedded in perps are still leaning toward long demand. That matters because it keeps the same fragility in place: a fresh downside impulse can turn newly reloaded longs into liquidation fuel again.
Adler summed up the combined signal from the two charts as a washout that may be intense, but not necessarily final.
Until those confirmations show up, the base case in his briefing is less “final capitulation” and more “incomplete deleveraging”, a market that has already flushed leverage once, but may not be done if long appetite stays intact through drawdowns.
At press time, BTC traded at $82,968.
You May Also Like

nLIGHT to Announce Fourth Quarter and Full Year 2025 Financial Results on February 26th
When silver became a meme stock, retail investors ultimately caught the falling knife.
