With extreme fear hanging across the crypto tokens, both red and green charts are found in the market. The bearish wave has eased for now, but the trend is stillWith extreme fear hanging across the crypto tokens, both red and green charts are found in the market. The bearish wave has eased for now, but the trend is still

Dogecoin (DOGE) Momentum Test: Can It Track the Path to $0.15 Amid the Red Hangs?

3 min read
  • DOGE is currently trading at the $0.10 mark. 
  • Dogecoin’s trading volume has dropped by 43%.

With extreme fear hanging across the crypto tokens, both red and green charts are found in the market. The bearish wave has eased for now, but the trend is still unfolding. Meanwhile, the meme coin market cap is at $38.10 billion following a 3% spike in the last 24 hours. Among them, Dogecoin (DOGE) has marked a 2.04% spike. 

The meme coin’s lowest and highest trading ranges were noted at $0.1058 and $0.11, respectively. As per CoinMarketCap data, at the time of writing, DOGE traded within the $0.1079 zone, with its daily trading volume dropping by over 43.76%, reaching $1.26 billion. Besides, the Dogecoin market has witnessed a liquidation event of $2.40 million. 

With the ongoing bearish correction, the DOGE price could retrace to the $0.1068 support range. If the downside move intensifies, the death cross might unfold and send the price below $0.1057. Conversely, a bullish reversal could trigger the Dogecoin price to rise to the nearest resistance at $0.1090. Assuming the upside pressure builds more traction, the golden cross would emerge, with the price climbing above $0.1102. 

A Downtrend Is Taking Shape for DOGE as Technical Momentum Weakens

DOGE’s Moving Average Convergence Divergence (MACD) line and the signal line are stationed below the zero line, hinting at a downtrend. It is trading below its longer-term average. Even with brief bounces, the broader trend remains weak, and only a bullish crossover gives signs of trend reversal. 

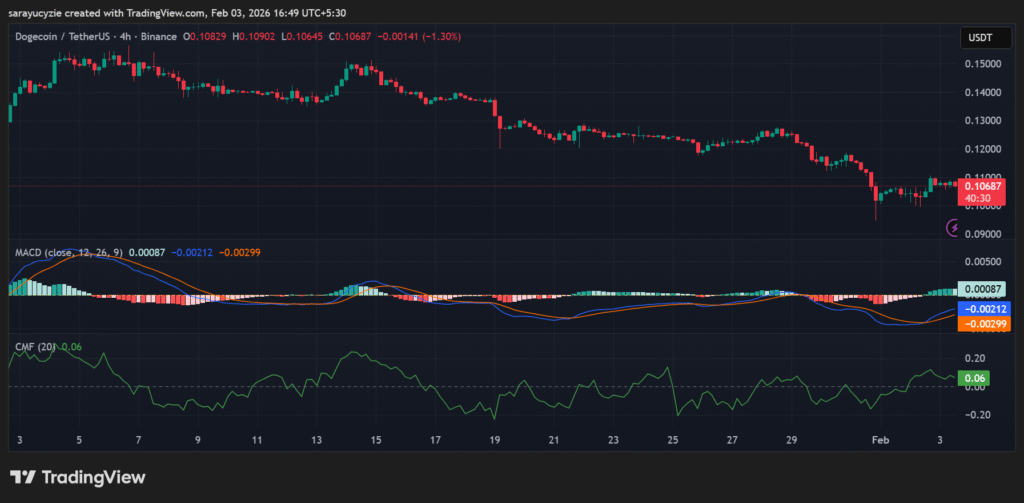
DOGE chart (Source: TradingView)

Moreover, the Chaikin Money Flow (CMF) indicator resting at 0.06 points to slight buying pressure in the Dogecoin market. As it is above zero, the money is flowing into the asset, showing mild accumulation. Notably, a sturdy buying interest is necessary to confirm a solid bullish trend. 

The daily Relative Strength Index (RSI) value of DOGE at 43.37 indicates neutral to slightly bearish sentiment. A seat below the 50 midline pushes the sellers to have a mild edge, and the momentum is weak, with no strong trend, and the market may be consolidating. 

Furthermore, Dogecoin’s Bull Bear Power (BBP) reading settled at 0.00120, suggesting an almost neutral market. However, the ongoing strength is extremely weak, and neither buyers nor sellers are in control. With indecision, a clear catalyst is needed to choose a direction.

Top Updated Crypto News

A 22% Rally Puts Hyperliquid (HYPE) in the Spotlight: Can It Clear the $40 Ceiling Before the Day Closes?

Disclaimer: The articles reposted on this site are sourced from public platforms and are provided for informational purposes only. They do not necessarily reflect the views of MEXC. All rights remain with the original authors. If you believe any content infringes on third-party rights, please contact service@support.mexc.com for removal. MEXC makes no guarantees regarding the accuracy, completeness, or timeliness of the content and is not responsible for any actions taken based on the information provided. The content does not constitute financial, legal, or other professional advice, nor should it be considered a recommendation or endorsement by MEXC.

You May Also Like

Securities Fraud Investigation Into Corcept Therapeutics Incorporated (CORT) Announced – Shareholders Who Lost Money Urged To Contact Glancy Prongay Wolke & Rotter LLP, a Leading Securities Fraud Law Firm

Securities Fraud Investigation Into Corcept Therapeutics Incorporated (CORT) Announced – Shareholders Who Lost Money Urged To Contact Glancy Prongay Wolke & Rotter LLP, a Leading Securities Fraud Law Firm

LOS ANGELES–(BUSINESS WIRE)–Glancy Prongay Wolke & Rotter LLP, a leading national shareholder rights law firm, today announced that it has commenced an investigation
Share
AI Journal2026/02/05 04:00
Microsoft Corp. $MSFT blue box area offers a buying opportunity

Microsoft Corp. $MSFT blue box area offers a buying opportunity

The post Microsoft Corp. $MSFT blue box area offers a buying opportunity appeared on BitcoinEthereumNews.com. In today’s article, we’ll examine the recent performance of Microsoft Corp. ($MSFT) through the lens of Elliott Wave Theory. We’ll review how the rally from the April 07, 2025 low unfolded as a 5-wave impulse followed by a 3-swing correction (ABC) and discuss our forecast for the next move. Let’s dive into the structure and expectations for this stock. Five wave impulse structure + ABC + WXY correction $MSFT 8H Elliott Wave chart 9.04.2025 In the 8-hour Elliott Wave count from Sep 04, 2025, we saw that $MSFT completed a 5-wave impulsive cycle at red III. As expected, this initial wave prompted a pullback. We anticipated this pullback to unfold in 3 swings and find buyers in the equal legs area between $497.02 and $471.06 This setup aligns with a typical Elliott Wave correction pattern (ABC), in which the market pauses briefly before resuming its primary trend. $MSFT 8H Elliott Wave chart 7.14.2025 The update, 10 days later, shows the stock finding support from the equal legs area as predicted allowing traders to get risk free. The stock is expected to bounce towards 525 – 532 before deciding if the bounce is a connector or the next leg higher. A break into new ATHs will confirm the latter and can see it trade higher towards 570 – 593 area. Until then, traders should get risk free and protect their capital in case of a WXY double correction. Conclusion In conclusion, our Elliott Wave analysis of Microsoft Corp. ($MSFT) suggested that it remains supported against April 07, 2025 lows and bounce from the blue box area. In the meantime, keep an eye out for any corrective pullbacks that may offer entry opportunities. By applying Elliott Wave Theory, traders can better anticipate the structure of upcoming moves and enhance risk management in volatile markets. Source: https://www.fxstreet.com/news/microsoft-corp-msft-blue-box-area-offers-a-buying-opportunity-202509171323
Share
BitcoinEthereumNews2025/09/18 03:50
Over 80% of 135 Ethereum L2s record below 1 user operation per second

Over 80% of 135 Ethereum L2s record below 1 user operation per second

The post Over 80% of 135 Ethereum L2s record below 1 user operation per second  appeared on BitcoinEthereumNews.com. Ethereum’s L2s are not doing too well. Data
Share
BitcoinEthereumNews2026/02/05 03:52