XRP price faltered at the $3.40 resistance and now faces downside risk to $3, as BlackRock’s confirmation of “no plans at this time” for a spot XRP ETF dampens investor optimism. XRP price analysis Ripple (XRP) was recently rejected at…XRP price faltered at the $3.40 resistance and now faces downside risk to $3, as BlackRock’s confirmation of “no plans at this time” for a spot XRP ETF dampens investor optimism. XRP price analysis Ripple (XRP) was recently rejected at…

XRP price risks sliding to $3 as Blackrock says it has “no plans at this time” for XRP ETF

2 min read

XRP price faltered at the $3.40 resistance and now faces downside risk to $3, as BlackRock’s confirmation of “no plans at this time” for a spot XRP ETF dampens investor optimism.

Summary
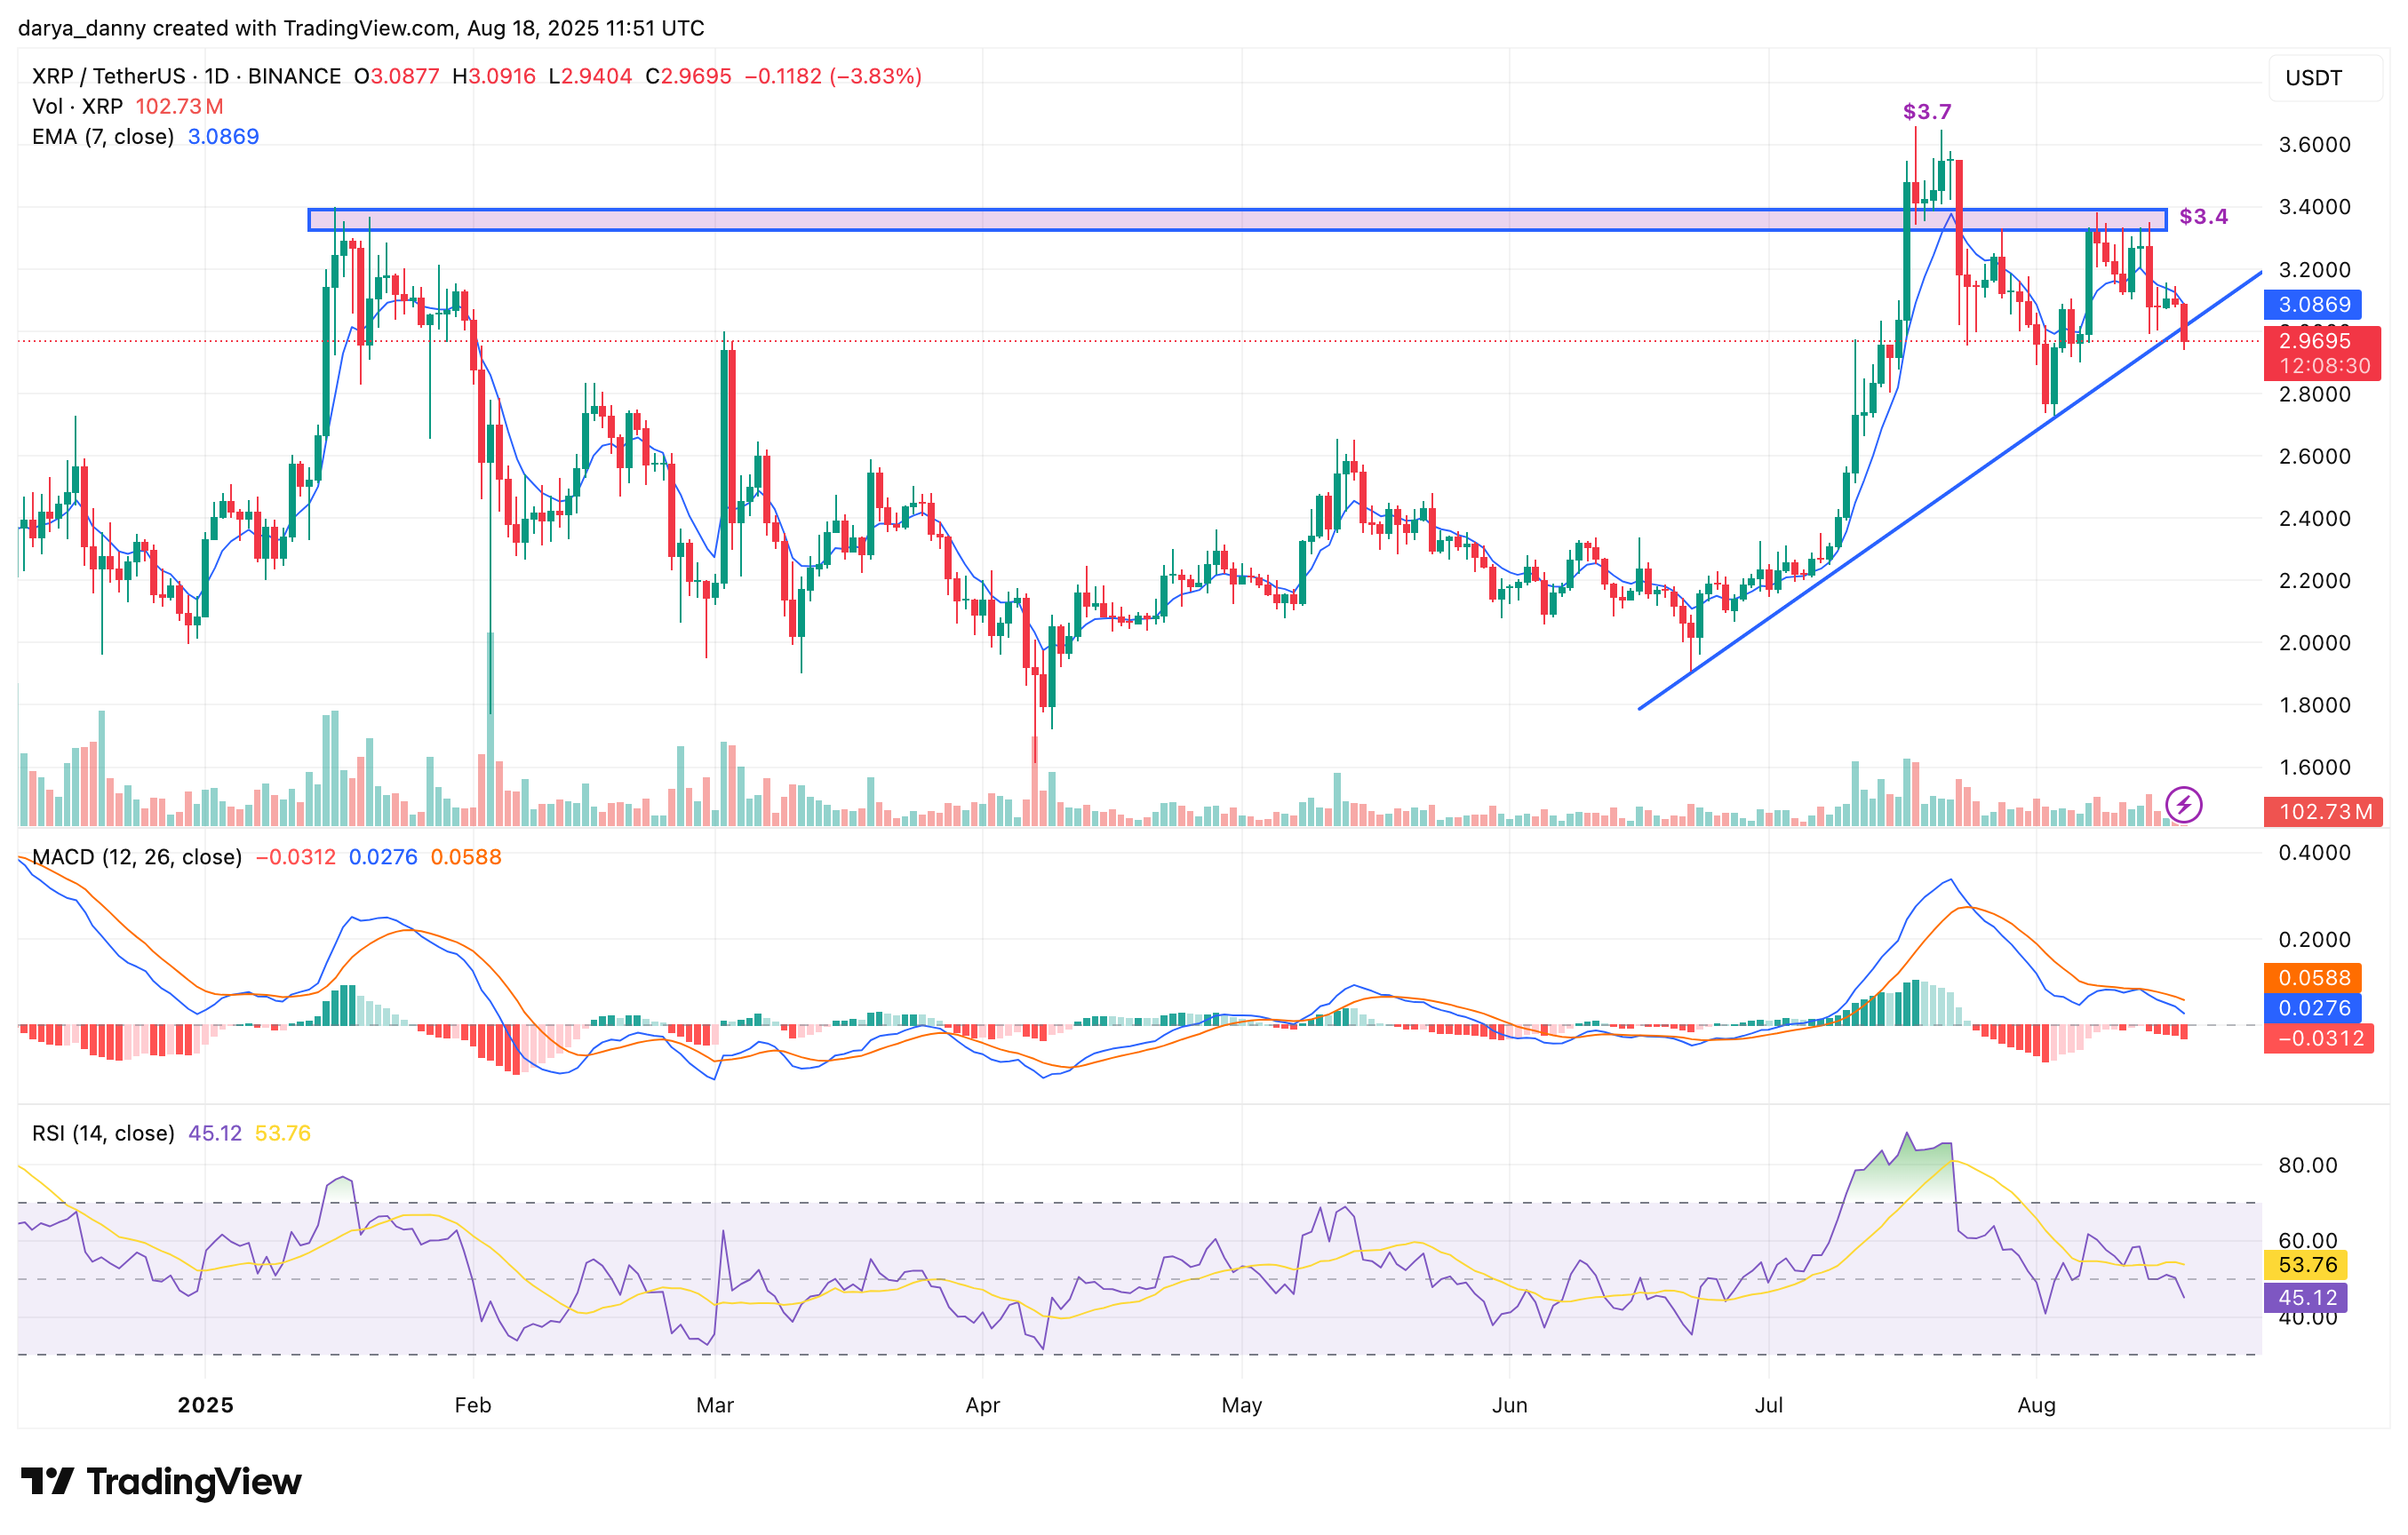
  • XRP price was recently rejected at $3.40, pulling back to trendline support; downside risks toward $3 next.
  • Multiple asset managers have filed XRP ETF applications, with analysts giving approval odds around 95%.
  • BlackRock has confirmed it currently has no plans to file a U.S. spot XRP ETF, quelling earlier speculation about its entry into the XRP ETF race.

XRP price analysis

Ripple (XRP) was recently rejected at the $3.40 resistance, dampening investor sentiment that had been lifted by news of the long-running legal battle with the U.S. SEC officially ending on August 7, after both parties jointly filed to dismiss all appeals in the U.S. Court of Appeals for the Second Circuit.

Expectations were high for XRP price to rally toward its ATH of $3.84, set eight years ago in January, after clearing $3.70. However, sellers stepped in, pushing the token down to its ascending trendline support. The daily chart now shows fading momentum, with the MACD histogram showing rising red bars and the RSI sliding to 45.

At press time, XRP trades at $2.97, slipping below the 7-day EMA at $3.08. Unless buyers reclaim this level quickly, the path of least resistance is to the downside. With a lower high already set at $3.40 on the daily chart, the risk of a breakdown further increases — first to the $3 support, and potentially toward $2.60.

XRP price risks sliding to $3 as Blackrock says it has "no plans at this time" for XRP ETF - 1

XRP ETFs: Is BlackRock in or not?

On the fundamental front, major asset managers including Grayscale, Bitwise, 21Shares, and Canary Capital have filed applications to launch XRP ETFs. Analysts estimate approval odds at around 95%, warming the longer-term sentiment.

On the flip side, BlackRock has publicly confirmed it has “no plans at this time” to file for a U.S. spot XRP ETF, despite earlier speculation from ETF Store president Nate Geraci that it’s only a matter of time before BlackRock enters the XRP ETF race.

Market Opportunity
XRP Logo
XRP Price(XRP)
$1.3095
$1.3095$1.3095
-15.17%
USD
XRP (XRP) Live Price Chart
Disclaimer: The articles reposted on this site are sourced from public platforms and are provided for informational purposes only. They do not necessarily reflect the views of MEXC. All rights remain with the original authors. If you believe any content infringes on third-party rights, please contact service@support.mexc.com for removal. MEXC makes no guarantees regarding the accuracy, completeness, or timeliness of the content and is not responsible for any actions taken based on the information provided. The content does not constitute financial, legal, or other professional advice, nor should it be considered a recommendation or endorsement by MEXC.
Tags:

You May Also Like

nLIGHT to Announce Fourth Quarter and Full Year 2025 Financial Results on February 26th

nLIGHT to Announce Fourth Quarter and Full Year 2025 Financial Results on February 26th

CAMAS, Wash.–(BUSINESS WIRE)–nLIGHT, Inc. (Nasdaq: LASR), a leading provider of high-power lasers for mission critical directed energy, optical sensing, and advanced
Share
AI Journal2026/02/05 21:16
When silver became a meme stock, retail investors ultimately caught the falling knife.

When silver became a meme stock, retail investors ultimately caught the falling knife.

Author: Xu Chao, Wall Street Insights "I lost a whole year's worth of after-tax salary today." This is a desperate cry left by a Reddit user on the forum last
Share
PANews2026/02/05 21:03
Analyst Predicts ‘Uptober’ Rally for BTC Regardless of FOMC Decision

Analyst Predicts ‘Uptober’ Rally for BTC Regardless of FOMC Decision

The post Analyst Predicts ‘Uptober’ Rally for BTC Regardless of FOMC Decision appeared on BitcoinEthereumNews.com. Bitcoin traded at $116,236 as of 14:04 UTC on Sept. 17, up about 1% in the past 24 hours, holding above a key level as markets await the Federal Reserve’s policy announcement. Analysts’ comments Dean Crypto Trades noted on X that bitcoin is only about 7% above its post-election local peak, while the S&P 500 has risen 9% and gold has surged 36% during the same period. He said bitcoin has compressed more than those assets, making it likely to lead the next larger move, though it could form a “lower high” before extending further. He added that ether could join in once it breaks $5,000 and enters price discovery. Lark Davis pointed to bitcoin’s history around September FOMC meetings, saying every September decision since 2020 — except during the 2022 bear market — has preceded a strong rally. He stressed that the pattern is less about the Fed’s rate choice itself and more about seasonal dynamics, arguing that bitcoin tends to thrive in this period heading into “Uptober.” CoinDesk Research’s technical analysis According to CoinDesk Research’s technical analysis data model, bitcoin rose about 0.9% during the Sept. 16–17 analysis window, climbing from $115,461 to $116,520. BTC reached a session high of $117,317 at 07:00 UTC on Sept. 17 before consolidating. Following that peak, bitcoin tested the $116,400–$116,600 range multiple times, confirming it as a short-term support zone. In the final hour of the session, between 11:39 and 12:38 UTC, BTC attempted a breakout: prices moved narrowly between $116,351 and $116,376 before spiking to $116,551 at 12:34 on higher volume. This confirmed a consolidation-breakout pattern, though the gains were modest. Overall, bitcoin remains firm above $116,000, with support around $116,400 and resistance near $117,300. Latest 24-hour and one-month chart analysis The latest 24-hour CoinDesk Data chart, ending 14:04 UTC on…
Share
BitcoinEthereumNews2025/09/18 12:42