

Why is Crypto Down Today? Let’s Dive In
TLDR
- Bitcoin dropped 3.2% to below $114,000 and Ether fell 5.3% to under $4,200 ahead of Fed policy events
- Crypto market cap declined by $107 billion to $3.77 trillion in 24 hours
- Fed will release July FOMC minutes on August 20 and Powell speaks at Jackson Hole on August 22
- Eight factors including tariff costs and sticky inflation suggest Fed may delay rate cuts
- Crypto-related stocks suffered bigger losses than general equities, with MARA down 5.7% and COIN down 5.8%
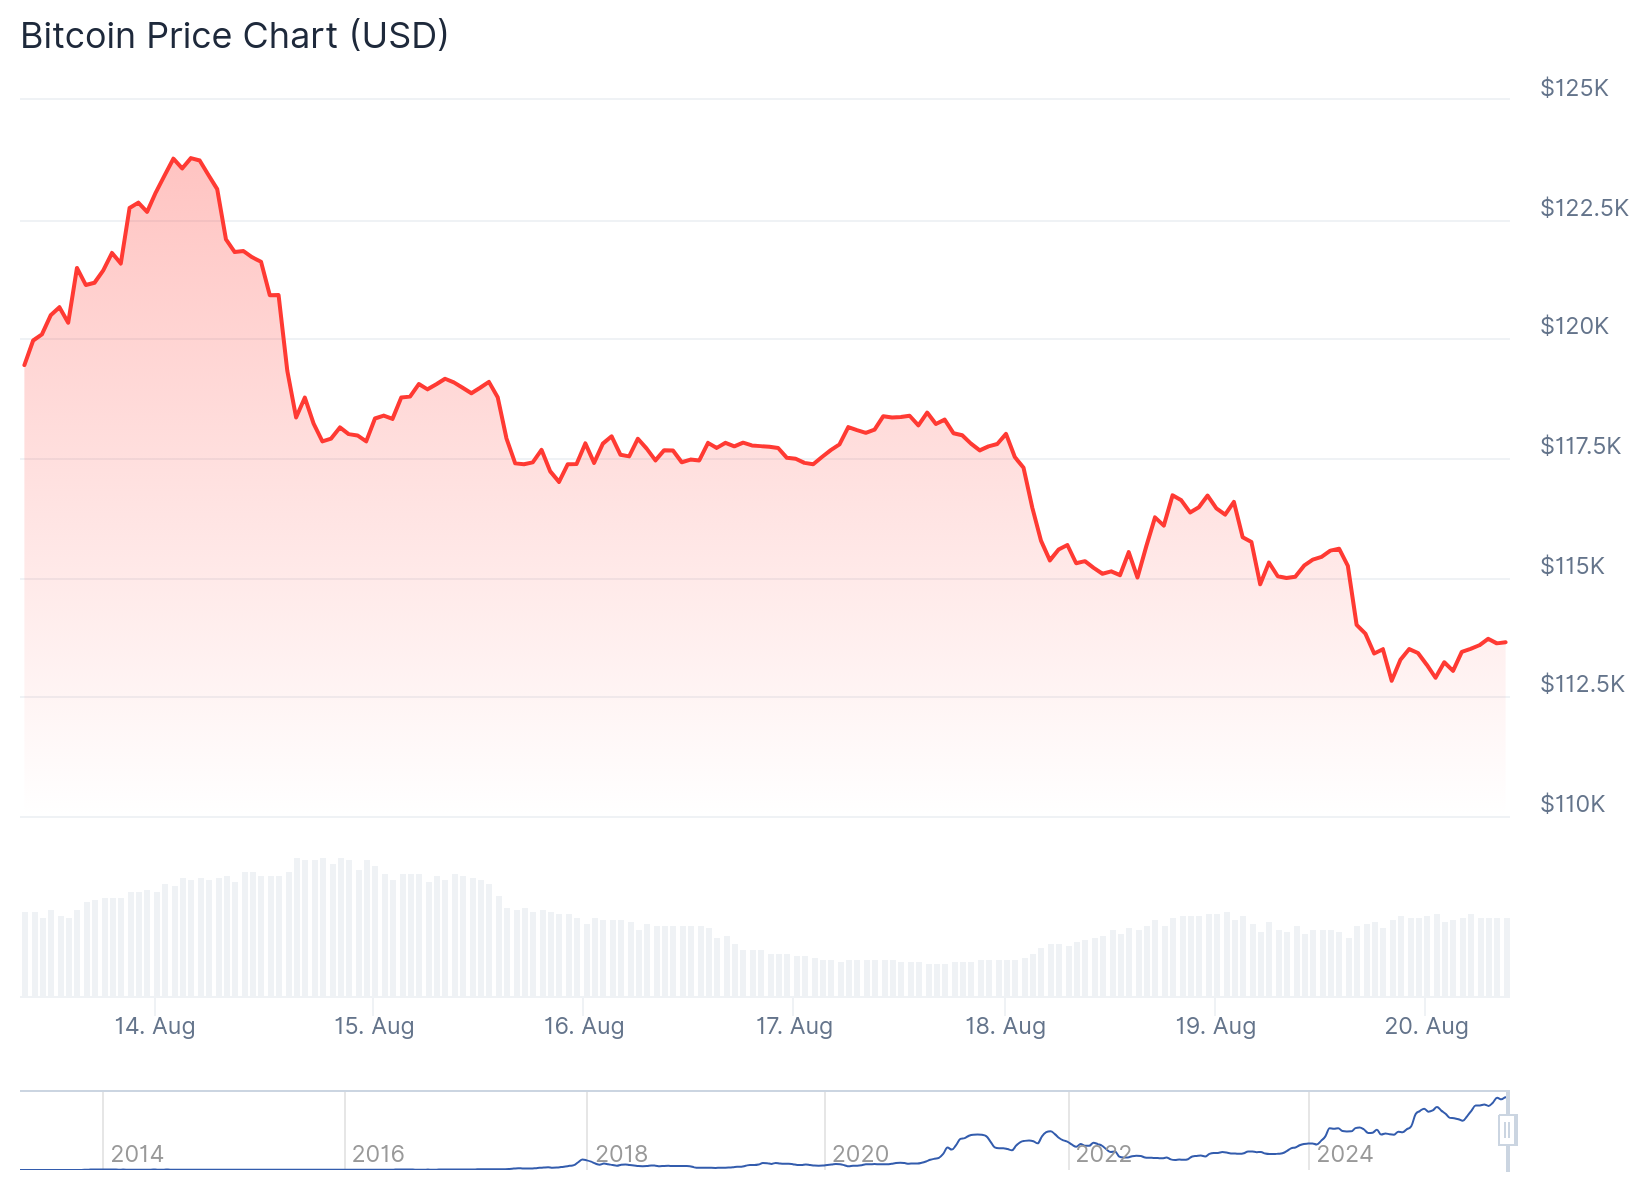
Cryptocurrency markets faced steep losses Tuesday as investors prepared for two key Federal Reserve events that could shape monetary policy direction. Bitcoin dropped 3.2% in 24 hours to slip below $114,000, while Ethereum fell 5.3% to under $4,200.
 Bitcoin (BTC) Price
The broader crypto market capitalization declined by $107 billion, settling at $3.77 trillion. This widespread selling affected most digital assets, with XRP tumbling 6.2% and Cardano’s ADA sliding 8% during the same period.
Crypto-related stocks experienced even steeper declines than the underlying digital assets. Mining company MARA closed down 5.7%, exchange operator Coinbase fell 5.8%, and MicroStrategy dropped 7.4% in Tuesday’s trading session.
 Source: Google Finance
Traditional equity markets showed more resilience by comparison. The Dow Jones ended flat, the S&P 500 fell 0.59%, and the Nasdaq declined about 1.5%. This performance gap highlights how digital assets remain more sensitive to interest rate expectations than conventional stocks.
Fed Events Drive Market Anxiety
Two Federal Reserve events this week have traders on edge. The Fed will release minutes from its July 29-30 FOMC meeting on August 20 at 2 p.m. ET, providing insight into policymakers’ discussions about inflation and economic conditions.
 Source: Forex Factory
Jerome Powell, the Fed Chair, will deliver his keynote speech at the Jackson Hole symposium on August 22 at 10 a.m. ET. Central bankers gather for this annual event from August 21-23, making it a closely watched policy forum.
These events could determine market expectations for the September Federal Reserve meeting. Traders are particularly focused on whether the central bank will cut interest rates next month or maintain current levels.
Multiple economic factors suggest the Fed may take a cautious approach to rate cuts. Companies have absorbed tariff costs to protect market share, but analysts warn they cannot continue this practice indefinitely.
Inflation Pressures Complicate Rate Cut Timing
Inflation data remains elevated despite some recent cooling. The producer price index, which measures wholesale prices, has exceeded forecasts, indicating persistent price pressures in the economy.
Corporate executives have signaled they will eventually need to pass tariff costs to consumers. This shift could accelerate consumer inflation in coming months, making a September rate cut appear premature to Fed officials.
Economic signals present a mixed picture that complicates Fed decision-making. Job growth has slowed while consumer demand remains strong, creating uncertainty about the economy’s direction.
Policy uncertainty around tariffs intersects with fiscal and trade policies in unpredictable ways. This complexity increases the risk of policy mistakes, potentially encouraging a more cautious Fed stance at Jackson Hole.
Historical precedent also influences Fed thinking. Tariff shocks during 2018-2019 produced delayed but meaningful inflation impacts, prompting central bank caution during that period.
The July FOMC minutes may reveal internal divisions among Fed officials. Hawks focus on inflation risks while doves emphasize employment concerns, creating potential for disagreement about policy direction.
Fresh economic data releases this week could influence Powell’s message. Thursday brings preliminary August data on manufacturing and services activity, which may show tariff-related cost pressures building.
For cryptocurrency markets, the stakes remain high. Higher interest rates for extended periods reduce the liquidity that typically fuels speculative rallies in digital assets.
Bitcoin currently trades at $113,461, having fallen below the $115,000 support level. The next critical support sits at $112,526, which has provided stability since early August.
The post Why is Crypto Down Today? Let’s Dive In appeared first on CoinCentral.
You May Also Like

Securities Fraud Investigation Into Corcept Therapeutics Incorporated (CORT) Announced – Shareholders Who Lost Money Urged To Contact Glancy Prongay Wolke & Rotter LLP, a Leading Securities Fraud Law Firm

Microsoft Corp. $MSFT blue box area offers a buying opportunity
