Gold (XAU) Price Prediction: Gold Holds Firm Above $5,000 as Bulls Assess Breakout Potential Beyond $5,086 Amid Short-Term Correction Risks
After sharp intraday swings earlier this week, gold has stabilized above the psychologically significant $5,000 per ounce level. This stabilization has helped preserve the broader bullish structure established over recent months, even as repeated selling interest near the $5,086–$5,100 resistance zone has slowed upside momentum.
Traders and analysts alike are increasingly focused on how near-term technical signals interact with macroeconomic developments, particularly movements in the U.S. dollar and expectations for future interest rate policy.
Gold Price Today: Market Holds Firm Above Key Support
The gold spot price is trading close to $5,050 per ounce, reflecting relative stability following recent pullbacks. According to widely cited market data, gold remains up nearly 10% on the month and more than 70% year-to-date, underscoring strong medium- and long-term performance despite short-term fluctuations.
Gold consolidates near $5,050, with $5,000 support and $5,086 resistance signaling potential uptrend or downside risk. Source: Alice via X
From a broader technical perspective, the $5,000 threshold has become a key reference point for the gold price today, functioning as both psychological support and a structural level tied to positioning and risk management. Intraday technical commentary suggests that sustained trading above this zone keeps the path open for renewed tests of resistance near $5,086. Conversely, a sustained breakdown below $5,000 would likely weaken the current gold price outlook and shift focus toward lower support zones.
Short-Term Volatility and Gold Price Resistance Levels
Recent price action has reinforced the market’s sensitivity to resistance in the $5,080–$5,100 range. This zone has repeatedly capped advances during U.S. trading hours, signaling the presence of active supply rather than a lack of underlying demand. Short-term market participants note that failure to hold above the $5,060 area often precedes corrective moves toward the $4,990–$5,020 support band.
Gold trades near $5,053, at risk of a short-term pullback if it fails to hold above $5,060. Source: Shirley via X
Earlier in the session, gold experienced a sharp but short-lived intraday decline of roughly 8%, briefly dropping from around $5,130 to near $4,720 before rebounding. Such moves are rare in spot markets and are typically associated with thin liquidity conditions, aggressive stop-loss triggering, or futures-driven liquidity sweeps rather than a fundamental shift in valuation. Similar price behavior has been observed during past gold rallies, including episodes following the $2,000 breakout in 2020, where abrupt pullbacks occurred before trend continuation.
Technical Structure and Gold Price Analysis
From a structural standpoint, gold is consolidating after an impulsive bullish advance, with higher highs and higher lows still visible on shorter timeframes. Momentum indicators such as the Relative Strength Index (RSI) remain above neutral levels, suggesting that bullish momentum has cooled but not reversed. This behavior is consistent with trend digestion rather than exhaustion.
Gold trades near $5,035, showing resilience above $5,000 amid mixed risk sentiment, dollar pressure, and technical support, with resistance at $5,090–$5,100. Source: XAU_Ron on TradingView
Sustained trading above short-term moving averages, including the 10-day average, continues to reinforce near-term support. At the same time, repeated failures near resistance have kept price action range-bound. In this environment, the gold price forecast short-term remains balanced: a confirmed breakout above the $5,086–$5,100 zone could open the path toward the next technical objective near $5,140, while acceptance below $5,000 would likely expose deeper support in the $4,980–$4,930 area.
Gold and Monetary Policy: Inflation, the Dollar, and Safe-Haven Demand
Gold’s recent price behavior is closely intertwined with broader macroeconomic dynamics, including monetary policy, the U.S. dollar, and safe-haven demand. Expectations that the Federal Reserve may ease interest rates later in 2026 have weighed on the dollar, indirectly supporting gold as a non-yielding asset. At the same time, easing geopolitical tensions and improved global risk sentiment have temporarily reduced safe-haven flows, contributing to short-term pullbacks.
Gold futures hit $5,054 on bullish sentiment from proposed Fed-Treasury coordination amid inflation concerns. Source: SilverTrade via X
Despite these crosscurrents, structural demand for gold remains strong. Central bank purchases continue to underpin global bullion demand, reinforcing gold’s role as a hedge against inflation, currency debasement, and macroeconomic uncertainty. Historically, similar consolidation phases have followed periods of policy-driven market volatility, including the 2020 and 2011 gold rallies, where temporary pullbacks preceded renewed upward momentum.
IAU Maintains Bullish Momentum on NYSE Amid Short-Term Consolidation
IAU, the iShares Gold Trust, continues to trade within a strong bullish structure on the NYSE, with ticker IAU holding near $95.63 as of February 10, 2026. The $IAU ETF has delivered robust performance, supported by gold’s broader uptrend, elevated inflows, and rising investor demand, while recent price swings highlight increased volatility across the precious metals market.
$IAU was trading at around $94.46, down 1.20% in the last 24 hours at press time. Source: TradingView
From a technical perspective, iShares Gold Trust remains firmly above its key moving averages, reinforcing a long-term uptrend despite short-term consolidation signals. Moving averages continue to flash Strong Buy, while oscillators are more mixed, suggesting momentum is cooling rather than reversing. This combination points to structural strength, but with near-term price action requiring confirmation before another sustained push higher.
Key levels show IAU support clustered near $92–93, with deeper support aligned with the 50-day moving average, while resistance sits near the $100–104 zone close to the 52-week high. Elevated volume and steady fund inflows indicate ongoing institutional interest, though the ETF may experience consolidation before attempting a breakout. Overall, the technical outlook for $IAU remains bullish in the medium term, with short-term caution warranted due to volatility near resistance.
Looking Ahead: Cautious Optimism with Clear Levels to Watch
Looking ahead, the gold market outlook remains constructive but measured. Analysts emphasize that while upside potential persists—particularly if resistance is decisively cleared—near-term corrections cannot be ruled out as markets digest upcoming U.S. inflation data and labor market reports. These releases remain key drivers of interest rate expectations and, by extension, gold price movement.
For longer-term holders, consolidation above $5,000 may be more significant than short-term volatility. For short-term traders, repeated rejection near the $5,100 zone increases the risk of mean reversion within the established range. Overall, the prevailing gold price prediction centers on stability above key support, with the next directional move likely determined by a combination of technical confirmation and evolving macroeconomic signals.


You May Also Like

GOP lawmaker sues ex-wife who accused him of throwing boiling water on her
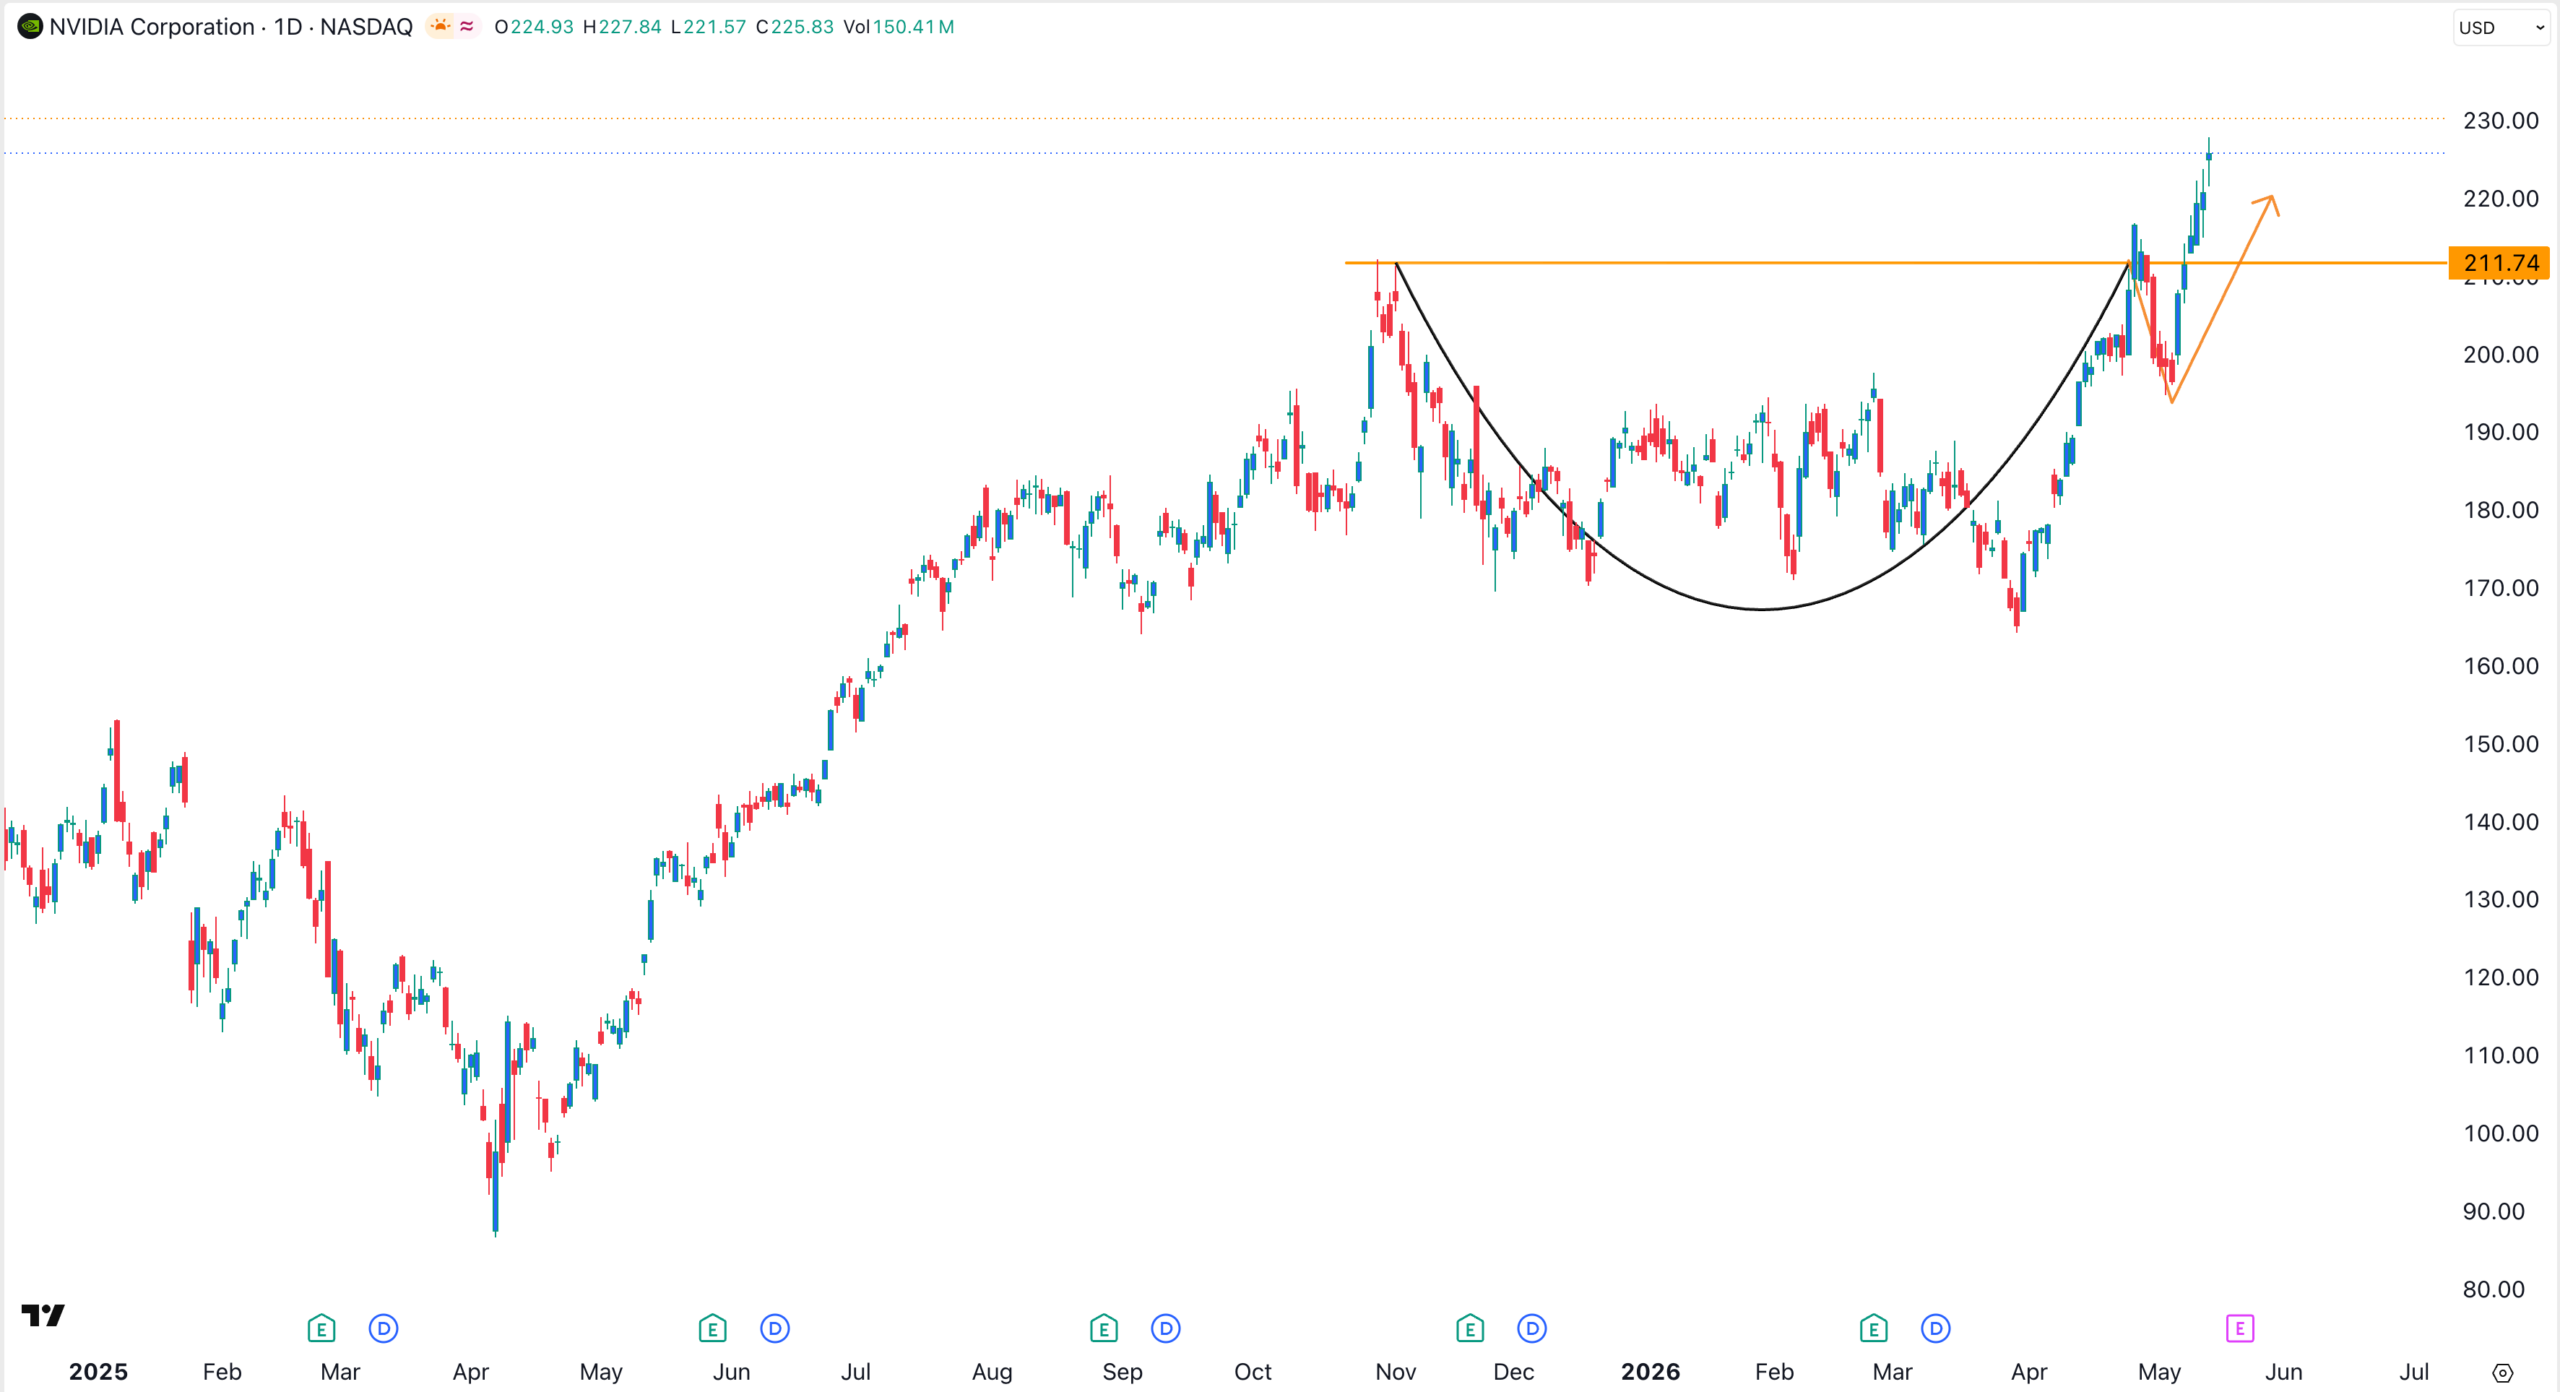
NVIDIA Stock Forecast as the US Clears H200 Chips Sales to China