The post Qtum (QTUM) Price Prediction 2026, 2027-2030: Is a 10x Comeback Possible? appeared first on Coinpedia Fintech News Story Highlights The Live Price Of QtumThe post Qtum (QTUM) Price Prediction 2026, 2027-2030: Is a 10x Comeback Possible? appeared first on Coinpedia Fintech News Story Highlights The Live Price Of Qtum

Qtum (QTUM) Price Prediction 2026, 2027-2030: Is a 10x Comeback Possible?

2026/02/11 15:31
6 min read
Qtum Price Prediction

The post Qtum (QTUM) Price Prediction 2026, 2027-2030: Is a 10x Comeback Possible? appeared first on Coinpedia Fintech News

Story Highlights

  • The Live Price Of Qtum Is  $ 0.87451522
  • Qtum price could reach a high of $3.20 in 2026.
  • QTUM could potentially surge to $15.73 by 2030, supported by community governance and innovation.

Qtum is a decentralized blockchain platform that combines Bitcoin’s UTXO transaction model with the Ethereum Virtual Machine (EVM). This hybrid design allows Qtum to offer Bitcoin-like security while supporting smart contracts and decentralized applications.

Unlike many early blockchains, Qtum runs on a Proof-of-Stake (PoS) consensus mechanism, making it more energy-efficient than a Proof-of-Work network.

Despite strong fundamentals, Qtum has struggled to maintain attention in a crowded Layer-1 market. As of now, QTUM coin is trading around $0.89, down from a high of $106.
Therefore, investors are questioning whether the project still has long-term potential.

So, let’s explore CoinPedia’s Qtum (QTUM) price prediction for 2026, 2027, and 2030.

Qtum Price Today

CryptocurrencyQtum
TokenQTUM
Price$0.8745 down -2.77%
Market Cap$ 92,665,311.66
24h Volume$ 12,801,783.0846
Circulating Supply105,961,919.50
Total Supply107,822,406.00
All-Time High$ 106.8760 on 07 January 2018
All-Time Low$ 0.7700 on 13 March 2020

Table of contents

  • Qtum (QTUM) Price Targets For February 2026
    • Technical Analysis
  • Qtum (QTUM) Price Prediction 2026
  • Qtum (QTUM) Price Prediction 2026 – 2030
    • Qtum Price (QTUM) Prediction 2026
    • QTUM Price Prediction 2027
    • Qtum Price Forecast 2028
    • Qtum Price Prediction 2029
    • Qtum Price (QTUM) Prediction 2030
  • What Does The Market Say?
  • CoinPedia’s Qtum (QTUM) Price Prediction
  • FAQs

Qtum (QTUM) Price Targets For February 2026

Qtum is improving its technology to stay competitive with newer blockchains. Recent upgrades to the Qtum x86 Virtual Machine now allow developers to use languages like C++ and Rust. 

However, after the successful v29.1 hard fork in January 2026, the network entered a new growth phase under its Post-Halving Roadmap. 

If these developments lead to higher on-chain activity and user adoption, QTUM price could recover from current levels and move toward $1.54 by the end of February.

Technical Analysis

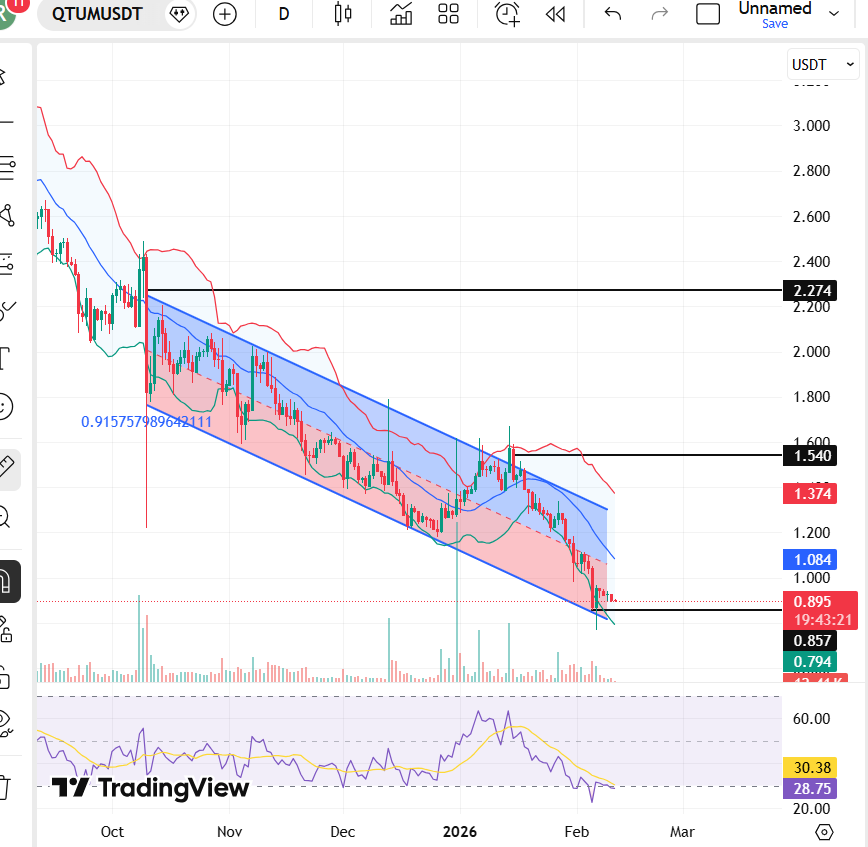
Looking at the QTUM 1-day price chart, QTUM is currently in a strong downtrend on the daily timeframe. The price has been moving inside a clear descending channel for several months, forming lower highs and lower lows. This confirms sellers remain in control. 

Right now, QTUM is trading near the key support zone around $0.85–$0.90, which is a critical level to hold. Immediate resistance lies at $1.08, followed by $1.54. 

The RSI is around 28–30, showing oversold conditions, which suggests a short-term bounce is possible.

Overall, the trend remains bearish until a confirmed breakout occurs.

Qtum (QTUM) Price Targets For February 2026
MonthPotential Low ($)Potential Average ($)Potential High ($)
QTUM Price Prediction February 2026$0.62$1.084$1.540

Qtum (QTUM) Price Prediction 2026

The year 2026 may serve as a rebuilding phase for Qtum. One of Qtum’s strongest differentiators is its hybrid architecture, which allows compatibility between Bitcoin-style security and Ethereum smart contracts.

Qtum founder Patrick Dai has announced plans for a native Qtum stablecoin, designed to reduce dependence on bridged assets and provide a reliable payment option within the network. 

With nearly 99% of QTUM tokens already unlocked, pressure from new supply is mostly gone. 

Thus, if Qtum positions itself as a stable and enterprise-friendly blockchain, QTUM could slowly rebuild investor confidence.

YearPotential Low ($)Potential Average ($)Potential High ($)
QTUM Price Prediction 2026$0.56$1.75$3.20

Qtum (QTUM) Price Prediction 2026 – 2030

YearPotential Low ($)Potential Average ($)Potential High ($)
2026$0.56$1.75$3.20
2027$1.20$2.43$5.80
2028$2.10$4.40$7.51
2029$3.26$6.10$10.20
2030$4.38$8.75$15.73

Qtum Price (QTUM) Prediction 2026

In 2026, market value is expected to grow mainly from on-chain utility, including the Ethereum USDC bridge and the planned native stablecoin launch.

QTUM Price Prediction 2027

By 2027, QTUM may see a gradual recovery towards $5.80 if staking participation rises and smart contract development improves.

Qtum Price Forecast 2028

Meanwhile, by 2028, if hybrid blockchain models regain relevance, the QTUM coin price could approach $7.51.

Qtum Price Prediction 2029

Block rewards were recently reduced from 0.5 to 0.25 QTUM, cutting the new supply. The next halving in 2029 will lower inflation to 0.125%, which could help push the QTUM price toward $10.20.

Qtum Price (QTUM) Prediction 2030

By 2030, if Qtum maintains consistent upgrades and attracts long-term builders, QTUM could test the $15.73 range.

What Does The Market Say?

Year202620272030
Changelly$3.88$5.92$24.88
DigitalCoinPrice$8.37$9.83$20.87
coincodex$3.48$2.91$0.631

CoinPedia’s Qtum (QTUM) Price Prediction

From a CoinPedia perspective, Qtum’s future depends less on hype and more on execution. Its hybrid model remains technically interesting, but adoption and developer engagement must increase for meaningful price recovery.

If Qtum successfully enhances interoperability, strengthens staking incentives, and positions itself for enterprise use, QTUM could see steady long-term growth.

CoinPedia analyst expects QTUM to recover gradually in 2026, with a potential high near $3.20.

YearPotential Low ($)Potential Average ($)Potential High ($)
2026$0.56$1.75$3.20
Never Miss a Beat in the Crypto World!

Stay ahead with breaking news, expert analysis, and real-time updates on the latest trends in Bitcoin, altcoins, DeFi, NFTs, and more.

bell icon Subscribe to Price Prediction

FAQs

What is the Qtum (QTUM) price prediction for 2026?

Qtum price prediction 2026 suggests a potential range between $0.56 and $3.20, depending on adoption, staking growth, and market conditions.

What is the QTUM price prediction for 2030?

Qtum price prediction 2030 estimates QTUM could reach up to $15.73 if upgrades, halving effects, and ecosystem growth continue steadily.

How High Can QTUM Price Go In 2040?

By 2040, QTUM price could potentially trade between $25 and $60 if adoption expands and long-term crypto demand stays strong.

Can QTUM price reach $5 again?

QTUM may approach $5 by 2027 if staking increases and market sentiment improves, but it remains dependent on broader crypto trends.

Is QTUM a good long-term investment?

QTUM has strong fundamentals, but long-term success depends on developer growth, enterprise use, and sustained network demand.

Market Opportunity
Qtum Logo
Qtum Price(QTUM)
$0.8806
$0.8806$0.8806
-2.88%
USD
Qtum (QTUM) Live Price Chart
Disclaimer: The articles reposted on this site are sourced from public platforms and are provided for informational purposes only. They do not necessarily reflect the views of MEXC. All rights remain with the original authors. If you believe any content infringes on third-party rights, please contact service@support.mexc.com for removal. MEXC makes no guarantees regarding the accuracy, completeness, or timeliness of the content and is not responsible for any actions taken based on the information provided. The content does not constitute financial, legal, or other professional advice, nor should it be considered a recommendation or endorsement by MEXC.

You May Also Like

Taiko Makes Chainlink Data Streams Its Official Oracle

Taiko Makes Chainlink Data Streams Its Official Oracle

The post Taiko Makes Chainlink Data Streams Its Official Oracle appeared on BitcoinEthereumNews.com. Key Notes Taiko has officially integrated Chainlink Data Streams for its Layer 2 network. The integration provides developers with high-speed market data to build advanced DeFi applications. The move aims to improve security and attract institutional adoption by using Chainlink’s established infrastructure. Taiko, an Ethereum-based ETH $4 514 24h volatility: 0.4% Market cap: $545.57 B Vol. 24h: $28.23 B Layer 2 rollup, has announced the integration of Chainlink LINK $23.26 24h volatility: 1.7% Market cap: $15.75 B Vol. 24h: $787.15 M Data Streams. The development comes as the underlying Ethereum network continues to see significant on-chain activity, including large sales from ETH whales. The partnership establishes Chainlink as the official oracle infrastructure for the network. It is designed to provide developers on the Taiko platform with reliable and high-speed market data, essential for building a wide range of decentralized finance (DeFi) applications, from complex derivatives platforms to more niche projects involving unique token governance models. According to the project’s official announcement on Sept. 17, the integration enables the creation of more advanced on-chain products that require high-quality, tamper-proof data to function securely. Taiko operates as a “based rollup,” which means it leverages Ethereum validators for transaction sequencing for strong decentralization. Boosting DeFi and Institutional Interest Oracles are fundamental services in the blockchain industry. They act as secure bridges that feed external, off-chain information to on-chain smart contracts. DeFi protocols, in particular, rely on oracles for accurate, real-time price feeds. Taiko leadership stated that using Chainlink’s infrastructure aligns with its goals. The team hopes the partnership will help attract institutional crypto investment and support the development of real-world applications, a goal that aligns with Chainlink’s broader mission to bring global data on-chain. Integrating real-world economic information is part of a broader industry trend. Just last week, Chainlink partnered with the Sei…
Share
BitcoinEthereumNews2025/09/18 03:34
August Crypto Market Review: ETH Leads the Rise, Institutional Funding and Macro Factors Dominate Market Trends

August Crypto Market Review: ETH Leads the Rise, Institutional Funding and Macro Factors Dominate Market Trends

By Jianing Wu , Galaxy Digital Compiled by Tim, PANews August saw various crossover signals between the macro economy and the crypto market. In traditional markets, investors faced conflicting inflation signals: the CPI released at the beginning of the month came in below expectations, but the subsequent Producer Price Index (PPI) came in above expectations. This was coupled with weakening employment data and growing market expectations that the Federal Reserve would begin cutting interest rates in September. At the end of the month's Fed meeting in Jackson Hole, Wyoming, Chairman Powell struck a dovish tone, emphasizing the "shifting balance of risks" brought about by rising unemployment, which reinforced expectations of a shift toward easing monetary policy. The stock market closed higher in a volatile session, with the S&P 500 fluctuating with the data releases. Defensive assets like gold outperformed at the end of the month. The crypto market reflected this macro uncertainty, with increased volatility. Bitcoin hit an all-time high of over $124,000 in mid-August before retreating to around $110,000, while Ethereum's gains for the entire month outpaced Bitcoin's. After experiencing its largest single-day outflow at the beginning of the month, Ethereum ETFs quickly attracted strong inflows, briefly surpassing Bitcoin's despite Ethereum's smaller market capitalization. However, the recovery in demand pushed ETH prices to a new high near $4,953, and the ETH/BTC exchange rate rose to 0.04 for the first time since November 2024. The fluctuations in ETF trading highlight that institutional position adjustments are increasingly influencing price trends, and ETH is clearly the leader in this cycle. In terms of laws and policies, regulators are gradually pushing forward reforms to reshape the industry landscape. The U.S. Department of Labor has opened the door to allocating crypto assets to 401(k) pension plans, while the U.S. SEC has explicitly stated that certain liquidity pledge businesses do not fall under the category of securities. Application trends at the market structure and institutional levels are deepening. Treasury Secretary Bessant disclosed for the first time that strategic Bitcoin reserves now hold between 120,000 and 170,000 coins, revealing the government's cumulative cryptocurrency holdings for the first time. Business activity is also accelerating: Stablecoin issuers Stripe and Circle announced plans to develop independent L1 blockchains, while Wyoming became the first state government in the US to issue a dollar-denominated stablecoin. Google also joined the enterprise blockchain fray with its "Universal Ledger" system. Meanwhile, crypto treasury companies continue to increase their asset allocation efforts. Overall, August reinforced two key trends. On the one hand, macro volatility and policy uncertainty triggered significant market volatility in both the equity and crypto markets; on the other, the underlying trend of market institutionalization is accelerating, from ETF flows to widespread adoption by sovereign institutions and corporations. These intertwining forces are likely to continue to dominate market movements as the autumn approaches, with the Federal Reserve's policy shift and ongoing structural demand likely setting the tone for the next phase of the cycle. 1. Spikes, Breakouts, and Reversals In the first half of August, Ethereum led the market, outperforming Bitcoin and driving a broad rally in altcoins. The Bloomberg Galaxy Crypto Index shows that Bitcoin hit an all-time high of $124,496 on August 13 before reversing course, closing the month at $109,127, down from $116,491 at the beginning of the month. A week later, on August 22, Ethereum broke through the previous cycle high, reaching $4,953, surpassing the November 2021 high of $4,866 and ending a four-year consolidation. Ethereum's strong performance is particularly noteworthy given its underperformance for much of this cycle. Since its April low near $1,400, the price of Ether has more than tripled, driven by strong ETF flows and purchases by crypto treasury firms. U.S. spot Ethereum ETFs saw net inflows of approximately $4 billion in August, the second-strongest month after July. In contrast, U.S. spot Bitcoin ETFs saw net outflows of approximately $639 million. However, despite a price decline in the last two weeks of August, Bitcoin ETF inflows turned positive. As market expectations for aggressive interest rate cuts from the Federal Reserve grew, Bitcoin's store-of-value narrative regained focus. As the likelihood of a rate cut increased, Bitcoin's correlation with gold strengthened significantly that month. Besides ETFs, crypto treasury firms remain a significant source of demand. These firms continued to increase their holdings throughout August, with Ethereum-focused treasuries in particular injecting significant capital. Because Ethereum's market capitalization is smaller than Bitcoin's, corporate capital inflows have a disproportionate impact on spot prices. A $1 billion allocation to Ethereum can significantly impact the market landscape, far more than a similar amount allocated to Bitcoin. Furthermore, significant funds remain undeployed among publicly disclosed crypto treasury firms, suggesting further positive market conditions. The total cryptocurrency market capitalization climbed to a record high of $4.2 trillion that month, demonstrating the deep correlation between crypto assets and broader market trends. Rising expectations of interest rate cuts boosted risk appetite in both the stock and crypto markets, while ETF inflows and corporate reserve accumulation directly contributed to record highs for BTC and ETH. Despite market volatility near the end of the month, the interplay of loose macro policies, institutional capital flows, and crypto treasury reserve needs has maintained the crypto market's central position in the risk asset narrative. 2. Each company launches its own L1 public chain Favorable regulations are giving businesses more confidence to enter the crypto market directly. In late July, US SEC Chairman Paul Atkins announced the launch of "Project Crypto," an initiative aimed at promoting the on-chain issuance and trading of stocks, bonds, and other financial instruments. This initiative marks a key step in the integration of traditional market infrastructure with blockchain technology. Encouraged by this, businesses are breaking through the limitations of existing blockchain applications and launching their own Layer 1 networks. In August, three major companies announced the launch of new L1 blockchains. Circle launched Arc, which is compatible with the EVM and uses its USDC stablecoin as its native gas token. Arc features compliance and privacy features, a built-in on-chain foreign exchange settlement engine, and will launch with a permissioned validator set. Following its acquisitions of stablecoin infrastructure provider Bridge and crypto wallet service provider Privy, Stripe launched Tempo Chain, also compatible with the EVM and focused on stablecoin payments and enterprise applications. Google released the Google Cloud Universal Ledger (GCUL), a private permissioned blockchain focused on payments and asset issuance. It supports Python-based smart contracts and has attracted CME Group as a pilot partner. The logic behind enterprise blockchain development boils down to value capture, control, and independent design. By owning the underlying protocol, companies like Circle avoid paying network fees to third parties and profit directly from transaction activity. Stripe, on the other hand, can more tightly integrate its proprietary blockchain with payment systems, developing new features for customers without relying on the governance mechanisms of other chains. Both companies view control as a key element of compliant operations, particularly as regulators increase their scrutiny of illicit financial activities. Choosing to build on L1 rather than L2 avoids being constrained by other blockchain networks in terms of settlement or consensus mechanisms. Reactions from the crypto-native community have been mixed. Many believe that projects like Arc and GCUL, while borrowing technical standards from existing L1 chains, are inferior in design and exclude Ethereum and other native assets. Critics point out that permissioned validators and corporate-led governance models undermine decentralization and user autonomy. These debates echo the failed wave of "enterprise blockchains" in the mid-2010s, which ultimately failed to attract real users. Despite skepticism, these companies' moves are significant. Stripe processes over $1 trillion in payments annually, holding approximately 17% of the global payment processing market. If Tempo can achieve lower costs or offer better developer tools, competitors may be forced to follow suit. Google's entry demonstrates that major tech companies view blockchain as the next evolutionary level of financial infrastructure. If these companies can bring their scale, distribution capabilities, and regulatory resources to this area, the impact could be profound. In addition to businesses launching their own Layer 1 chains, other developments reinforce the trend of economic activity migrating on-chain. U.S. Secretary of Commerce Lutnick announced that GDP data will be published on public blockchains via oracle networks such as Chainlink and Python. Galaxy tokenized its shares to test on-chain secondary market trading. These initiatives demonstrate that businesses and governments are beginning to embed blockchain technology into core financial and data infrastructure, despite ongoing debate over the appropriate balance between compliance and decentralization. 3. Hot Trend: Crypto Treasury Companies The crypto treasury trends we highlighted in our earlier report continue. Bitcoin, Ethereum, and Solver (SOL) holdings continue to accumulate, with Ethereum showing the strongest performance. Holdings data shows a sharp rise in ETH's crypto treasury throughout August, primarily driven by Bitmine's reserves, which increased from approximately 625,000 ETH at the beginning of August to over 2 million currently. Solver holdings also maintained steady growth, while BTC holdings continued their slower but steady accumulation. Compared to ETF fund flows, the activity of crypto treasury companies appears relatively flat. In July and August, ETF fund inflows were stronger than those of crypto treasury companies, and the cumulative balance of ETFs also exceeded the cumulative size of crypto treasury companies. This divergence is becoming increasingly apparent as premiums on crypto treasury stocks shrink across the board. Earlier this summer, price-to-earnings ratios for crypto treasury companies were significantly higher than their net asset values, but these premiums have gradually returned to more normal levels, signaling a growing caution among stock market investors. The stock price fluctuations are evident: KindlyMD (Nakamoto's parent company) has fallen from a peak of nearly $25 in late May to around $5, while Bitmine has fallen from $62 in early August to around $46. Selling pressure intensified in late August amid reports that Nasdaq may tighten its oversight of acquisitions of crypto treasury companies through stock offerings. This news accelerated the sell-off in shares of Ethereum-focused crypto treasury companies. Bitcoin-focused companies, such as Strategy (formerly MicroStrategy, ticker symbol: MSTR), were less affected because their acquisition strategies rely more on debt financing than equity issuance. 4. Hot Trend: Copycat Season Another hot trend is the rotation into altcoins. Bitcoin's dominance has gradually declined, from approximately 60% at the beginning of August to 56.5% by the end of the month, while Ethereum's market share has risen from 11.7% to 13.6%. Data indicates a rotation out of Bitcoin into Ethereum and other cryptocurrencies, which aligns with the outperformance of Ethereum ETFs and inflows into crypto treasury firms. While Bitcoin ETF inflows have rebounded in recent weeks, the overall trend remains unchanged: this cycle continues to expand beyond Bitcoin, with Ethereum and altcoins gaining incremental market share. 5. Our views and predictions As markets head into the final weeks of September, all eyes are on the Federal Reserve. Labor market weakness is solidifying expectations of a near-term rate cut and reinforcing risk assets. The jobs report underscores that the economic slowdown may be deeper than initially reported, raising questions about how much easing policy will be needed to cushion the economy. Meanwhile, the long end of the yield curve is flashing warning signs. Persistently high 10-year and 30-year Treasury yields reflect market concerns that inflation may be sticky and that fiscal pressures may ultimately force central banks to finance debt and spending through money printing. Expectations of short-term interest rate cuts are driving a rebound in risky assets, but the tug-of-war between short-term support from rate cuts and long-term concerns pushing yields and precious metals higher will determine the sustainability of this rebound. This conflicting dynamic has a direct impact on cryptocurrencies: Bitcoin's correlation with gold as a store of value and hedge is growing, while Ethereum and altcoins remain more sensitive to shifts in overall risk appetite.
Share
PANews2025/09/18 17:40
Why PEPE May Become the Most Important Meme Coin of This Cycle

Why PEPE May Become the Most Important Meme Coin of This Cycle

Pepe has moved back into focus during a period when the wider crypto market feels slow and uncertain. Conversation around PEPE price now centers on long-term relevance
Share
Captainaltcoin2026/02/11 16:00