

Cardano Price Today: ADA Stuck Near Lows as Market Trades in Extreme Fear

In a market gripped by extreme fear, Cardano price today sits near recent lows as traders weigh whether this pressure zone becomes a base or just another pause in the downtrend.
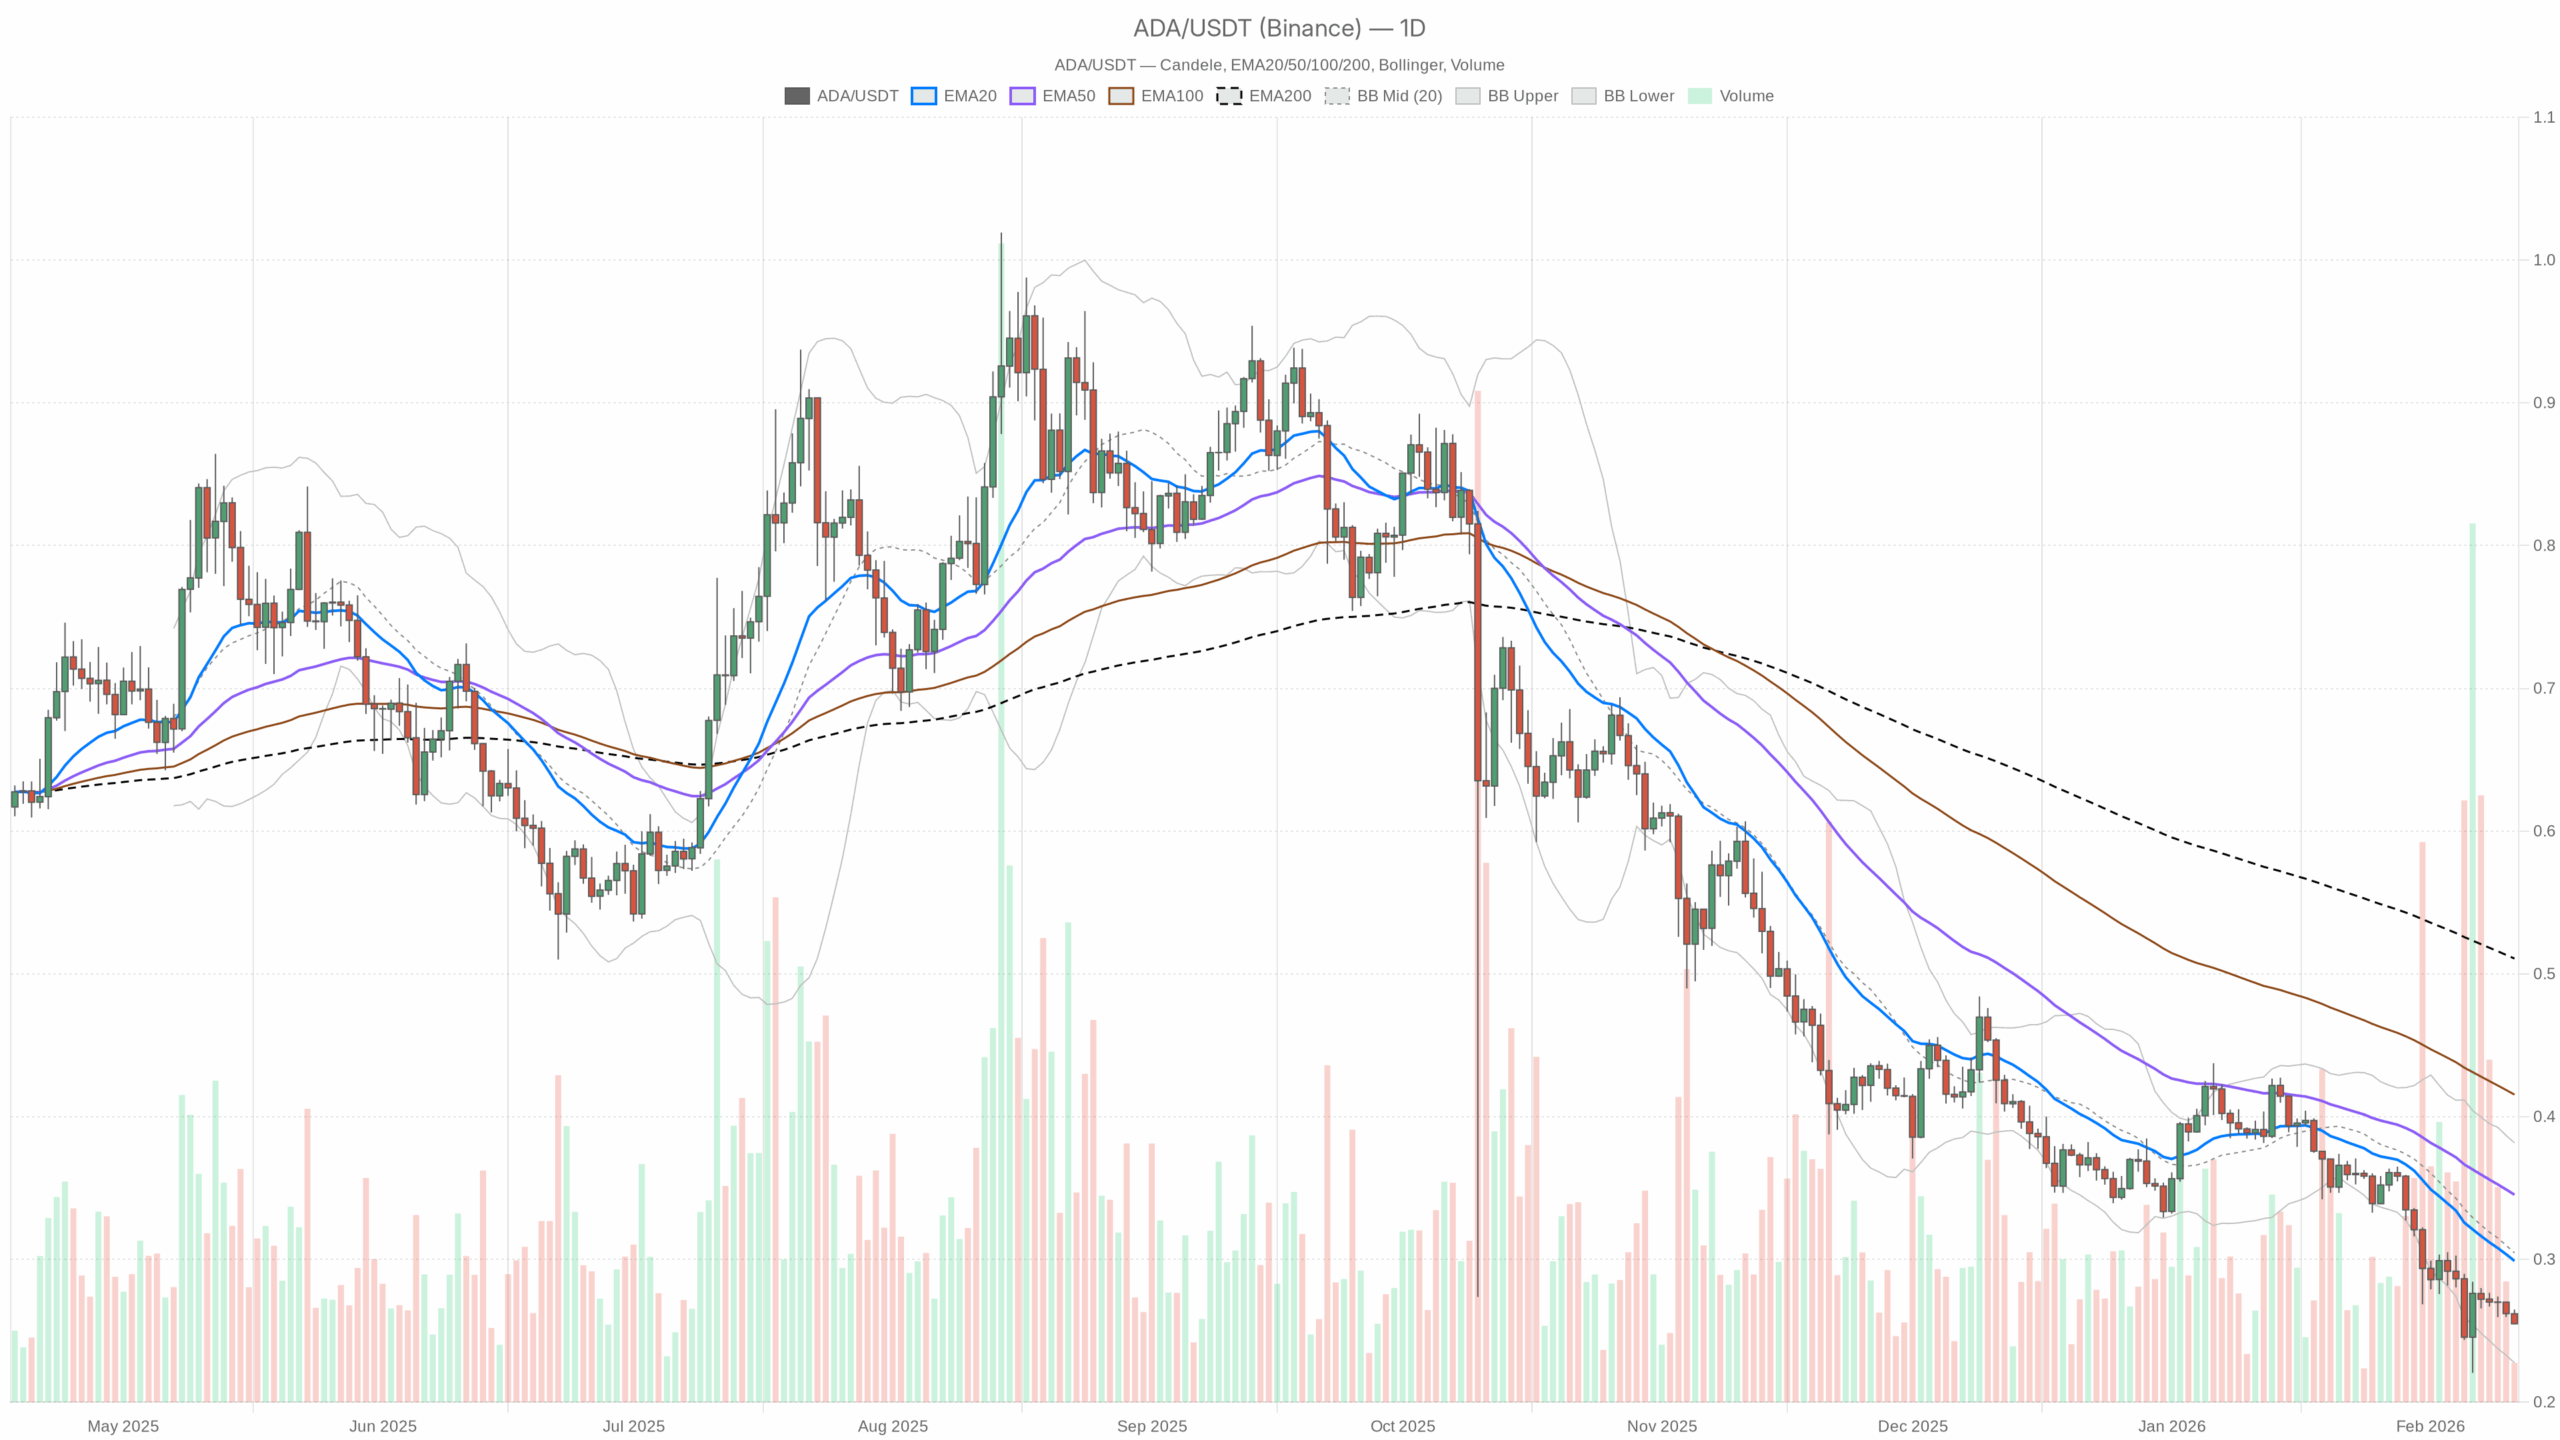 ADA/USDT — daily chart with candlesticks, EMA20/EMA50 and volume.
Cardano price today: where ADA stands
Cardano (ADA) is trading around $0.25–0.26 against USDT, pinned near recent lows in a market backdrop defined by extreme fear (fear & greed index at 11) and broad crypto weakness (total market cap down almost 3% in 24 hours, BTC dominance near 57%).
The dominant force right now is risk-off positioning across crypto, and ADA is on the wrong side of momentum: price sits well below all key daily moving averages and is riding the lower side of its volatility bands. This is a bearing-down phase of a downtrend, not yet an established bottom.
On the daily timeframe, the main scenario is clearly bearish. The question now is whether ADA is carving out a short-term base for a bounce, or just pausing before another leg lower.
Daily timeframe (D1): macro bias is bearish
Price vs EMAs (trend structure)
– Close: $0.25
– EMA 20: $0.30
– EMA 50: $0.35
– EMA 200: $0.51
ADA is trading far below the 20, 50, and 200-day EMAs. Short-term trend (20 EMA), medium-term trend (50 EMA), and the long-term cycle (200 EMA) are all stacked above price and sloping down.
What it implies: this is a mature downtrend where rallies are, by default, suspect. Bulls need multiple strong days just to retake the 20-day EMA around $0.30 before any talk of trend repair becomes credible.
RSI (momentum and exhaustion)
– RSI 14 (D1): 31.21
Daily RSI is hugging the edge of oversold without a bounce yet.
What it implies: sellers have been in control, but the downside momentum is approaching exhaustion territory. This is where two things are possible: either a reflexive bounce as shorts take profit, or a grind lower where price stays depressed for longer. There is no confirmed bullish divergence here, so this is cautionary oversold, not a buy signal on its own.
MACD (trend momentum)
– MACD line: -0.03
– Signal line: -0.03
– Histogram: 0
MACD is negative, but the line and signal are effectively sitting on top of each other and the histogram is flat.
What it implies: downside momentum has cooled. The trend is still down, but the impulse phase has stalled. This is typical of a market either basing for a bounce or preparing for a fresh impulse after a pause. There is not yet a bullish cross; it is more of a ceasefire.
Bollinger Bands (volatility & position)
– Middle band (20 MA): $0.30
– Upper band: $0.38
– Lower band: $0.23
– Price: $0.25, close to the lower band
Price is riding the lower half of the Bollinger envelope, not snapping below it.
What it implies: ADA is trading in the cheap zone of its recent range but without capitulation. Volatility is elevated relative to ATR (see below), but the market is not in a volatility spike or squeeze. It is a pressured, one-sided phase where bids remain cautious.
ATR (volatility and risk size)
– ATR 14 (D1): $0.03
Daily average true range is about 3 cents on a 25-cent asset, around 12% daily swing potential.
What it implies: this is a high-volatility environment relative to price level. Position sizing and leverage tolerance need to reflect that a routine daily move can easily be 10–15% in either direction.
Daily pivot levels (near-term map)
– Pivot point (PP): $0.26
– First resistance (R1): $0.26 (clustered with PP)
– First support (S1): $0.25
The pivot cluster around $0.26 with S1 at $0.25 is unusually tight.
What it implies: the market is compressed near the lows, with a very narrow battle zone. Sustained trading above $0.26 would be the first small sign of intraday strength; losing $0.25 opens the door to a push toward the Bollinger lower band near $0.23.
Daily regime: bearish.
The daily chart sets a clear bearish bias: trend is down, price is depressed, and the broader crypto environment is risk-off.
Hourly timeframe (H1): heavy but trying to stabilize
On the 1-hour chart, ADA is trading around $0.26, basically glued to its short-term averages.
Price vs EMAs (short-term trend)
– Close: $0.26
– EMA 20: $0.26
– EMA 50: $0.26
– EMA 200: $0.28
Price is sitting directly on the 20 and 50 EMAs, with the 200 EMA still above.
What it implies: short-term momentum has flattened out after the selloff. This is a classic equilibrium after a drop: bears are no longer in full control intraday, but bulls are not strong enough to reclaim the bigger moving average at $0.28.
RSI (intraday momentum)
– RSI 14 (H1): 26.84
Hourly RSI is clearly oversold.
What it implies: the short-term tape is stretched to the downside. That favors at least a relief bounce or consolidation rather than immediate continuation, but oversold on its own does not reverse a daily downtrend.
MACD (H1)
– MACD line: 0
– Signal: 0
– Histogram: 0
MACD is completely flat on the hourly.
What it implies: momentum has been wrung out of the intraday move; the market is in a waiting phase. Traders are watching for the next impulse rather than chasing continuation.
Bollinger Bands (H1)
– Middle band: $0.26
– Upper band: $0.27
– Lower band: $0.26
Bands are extremely tight, clustering between $0.26 and $0.27.
What it implies: this is a volatility compression zone right above support. These periods usually precede a sharp expansion move. Given the daily trend, the burden of proof is on the bulls. However, the setup is binary: a quick push either above $0.27 or below $0.25 is likely to define the next leg.
ATR (H1)
– ATR 14 (H1): $0.00 (effectively extremely low)
Intraday ATR printing near zero reflects the current micro-range.
What it implies: ADA is in a tight intraday coil. Once that breaks, the actual realized move can be much larger than what the current ATR reading suggests.
Hourly pivot levels
– Pivot point (PP): $0.26
– R1: $0.26
– S1: $0.25
Again, a very narrow band.
What it implies: $0.25–0.26 is the immediate battlefield. Scalpers will watch acceptance above the pivot at $0.26 for a push into $0.27–0.28, while a firm break under $0.25 puts the daily lower Bollinger band into play.
Hourly regime: bearish, but short-term pressure is easing into sideways.
15-minute timeframe (M15): execution zone around support
On the 15-minute chart, ADA trades near $0.25, slightly below its short intraday averages.
Price vs EMAs (very short-term flow)
– Close: $0.25
– EMA 20: $0.26
– EMA 50: $0.26
– EMA 200: $0.26
Price is under all three EMAs clustered around $0.26.
What it implies: the very short-term flow is still biased lower, but the EMAs are flat and tightly packed, which fits a local base-building attempt after a strong drop.
RSI (M15)
– RSI 14: 32.83
15-minute RSI is weak but not fully oversold.
What it implies: sellers remain present on small timeframes, but the capitulation phase is over. Short-term traders are probing both sides around support.
MACD (M15)
– MACD line: 0
– Signal: 0
– Histogram: 0
Momentum is neutral on this micro timeframe.
What it implies: execution here is about levels rather than trend: entries and exits will hinge on how price behaves at $0.25–0.26, not on any clear momentum signal.
Bollinger Bands (M15)
– Middle band: $0.26
– Upper band: $0.26
– Lower band: $0.25
Bands are narrow, hugging current price.
What it implies: the microstructure is balanced but fragile. A quick push above $0.26 or below $0.25 can trigger stop cascades due to the compressed bands.
ATR (M15)
– ATR 14 (M15): $0.00 (practically negligible)
Very low intraday ATR reflects the short-term stalemate.
What it implies: order book is quiet; any sudden increase in volume can move price more than these readings would suggest.
M15 regime: bearish, but in consolidation.
Bullish scenario for ADA/USDT
For the bull case, ADA needs to turn this oversold pressure zone into a durable base.
Key steps:
1. Hold $0.25 support
The immediate must-hold level is $0.25 (S1 on both daily and intraday). As long as daily candles avoid a clean close below that level, dip buyers can argue a short-term bottom attempt.
2. Reclaim the intraday cluster
A sustained push above $0.26 with 1-hour closes holding that pivot, followed by a test of $0.27–0.28 (near the H1 200 EMA), would signal that short-term momentum is flipping from defense to countertrend rally.
3. Daily relief leg
If the 1H 200 EMA around $0.28 gets reclaimed, the natural magnet above is the daily 20 EMA at $0.30. That is the first meaningful target for any relief rally. From there, a more ambitious objective would be the mid-range area around $0.33–0.35 (toward the daily 50 EMA), but that would likely require an improvement in overall market risk sentiment, not just ADA-specific buying.
4. Momentum confirmation
A bull-friendly configuration would be: daily RSI lifting back above 40, MACD starting to curl up with a positive histogram, and price holding above the 20-day EMA on pullbacks. That would shift the narrative from a dead-cat bounce to early repair.
What invalidates the bullish scenario?
A clean daily close below $0.25, especially if price accelerates toward the lower Bollinger band around $0.23 with RSI sinking deeper into the 20s, would argue that the attempted base has failed. In that case, ADA re-enters a trend-acceleration phase rather than a bottoming phase.
Bearish scenario for ADA/USDT
The bears still have control on the higher timeframe, and the macro environment backs them.
1. Break of $0.25 and trend continuation
If support at $0.25 finally gives way with expanding volume, the path of least resistance is toward the $0.23 area (daily lower Bollinger band) and potentially lower if the broader market remains under stress.
2. Failure to reclaim $0.28
As long as ADA remains below the H1 200 EMA at $0.28 and well under the daily 20 EMA at $0.30, every bounce is structurally just a rally into resistance. That aligns with daily EMAs all stacked above price and rolling over.
3. Momentum staying weak
If daily RSI hovers around or below 30 without any strong rebound, and MACD remains negative or turns down again after this pause, it signals a persistent seller’s market where rallies are likely to be sold quickly.
4. Macro risk-off persists
With global crypto market cap dropping and BTC dominance near 57%, altcoins like ADA typically underperform. In an environment of extreme fear, capital tends to cluster into BTC, stablecoins, or out of crypto altogether. ADA’s underperformance versus its moving averages fits that pattern.
What invalidates the bearish scenario?
If ADA reclaims and holds above $0.30 on the daily chart (the 20-day EMA) with improving RSI (above 45) and a constructive MACD curl, the assumption of a straightforward downtrend continuation breaks. At that point, bears have to treat the move as a potential trend-change attempt rather than a rally to fade.
How to think about positioning around Cardano price today
ADA today is a downtrend in a fearful market, sitting near support with compressed intraday volatility. That combination usually leads to binary outcomes: either a sharp bounce off support as shorts cover and bargain hunters step in, or a clean breakdown that catches late dip-buyers off guard.
The daily bias is bearish, but the short-term intraday structure is more tired than aggressive. Mean-reversion traders will naturally be eyeing the $0.25 area for bounce attempts; trend followers will be more interested in selling failed rallies into $0.28–0.30 as long as daily structure stays damaged.
Volatility, both realized and potential, remains high relative to ADA’s price level. That makes position size, leverage, and time horizon more important than entry precision. In a backdrop of extreme fear, surprises tend to be violent, in both directions.
For now, Cardano price today is less about a clear reversal or breakout, and more about how the market resolves this tight $0.25–0.26 range inside a broader downtrend. Traders who stay focused on key levels ($0.25 support, $0.26 pivot, $0.28–0.30 resistance band) and on the alignment between daily and intraday momentum will have a better read on which side of that binary outcome is starting to win.
You May Also Like

Tokenization: France and Europe Lead the Digital Asset Revolution

Tom Lee Urges Dip Buying as Bitcoin Sits 50% Below Highs
