

Medical AI Models Battle It Out—And the Winner Might Surprise You
Table of Links
Abstract and 1. Introduction
-
Materials and Methods
2.1 Vector Database and Indexing
2.2 Feature Extractors
2.3 Dataset and Pre-processing
2.4 Search and Retrieval
2.5 Re-ranking retrieval and evaluation
-
Evaluation and 3.1 Search and Retrieval
3.2 Re-ranking
-
Discussion
4.1 Dataset and 4.2 Re-ranking
4.3 Embeddings
4.4 Volume-based, Region-based and Localized Retrieval and 4.5 Localization-ratio
-
Conclusion, Acknowledgement, and References
3 Evaluation
In this section, we evaluate the retrieval recall of the methods explained in Section 2.4 and Section 2.5. The results related to the 29 coarse anatomical structures from Table 1 and the results related to the original 104 fine-grained anatomical structures from Wasserthal et al. [2023] are presented separately in the following. In the tables presented in this section, the average and standard deviation (STD) columns allow identifying difficult classes across models (low average) and the ones that have higher variations among models (higher STD). The average and STD rows show the average and STD over all the classes for each model.
3.1 Search and Retrieval
3.1.1 Slice-wise
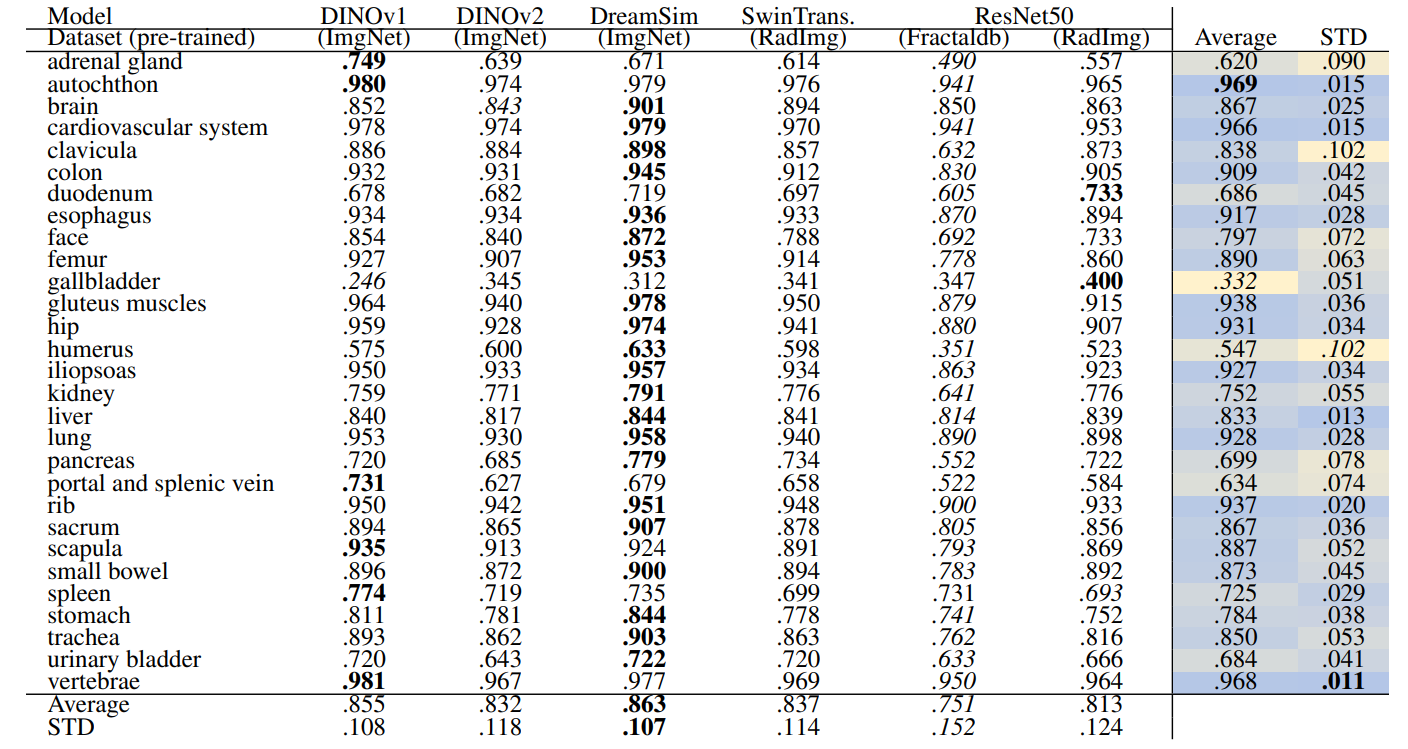
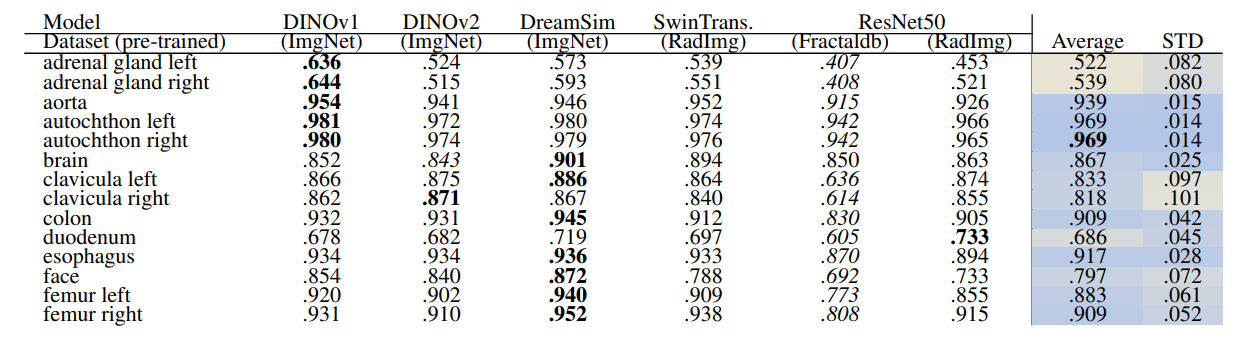
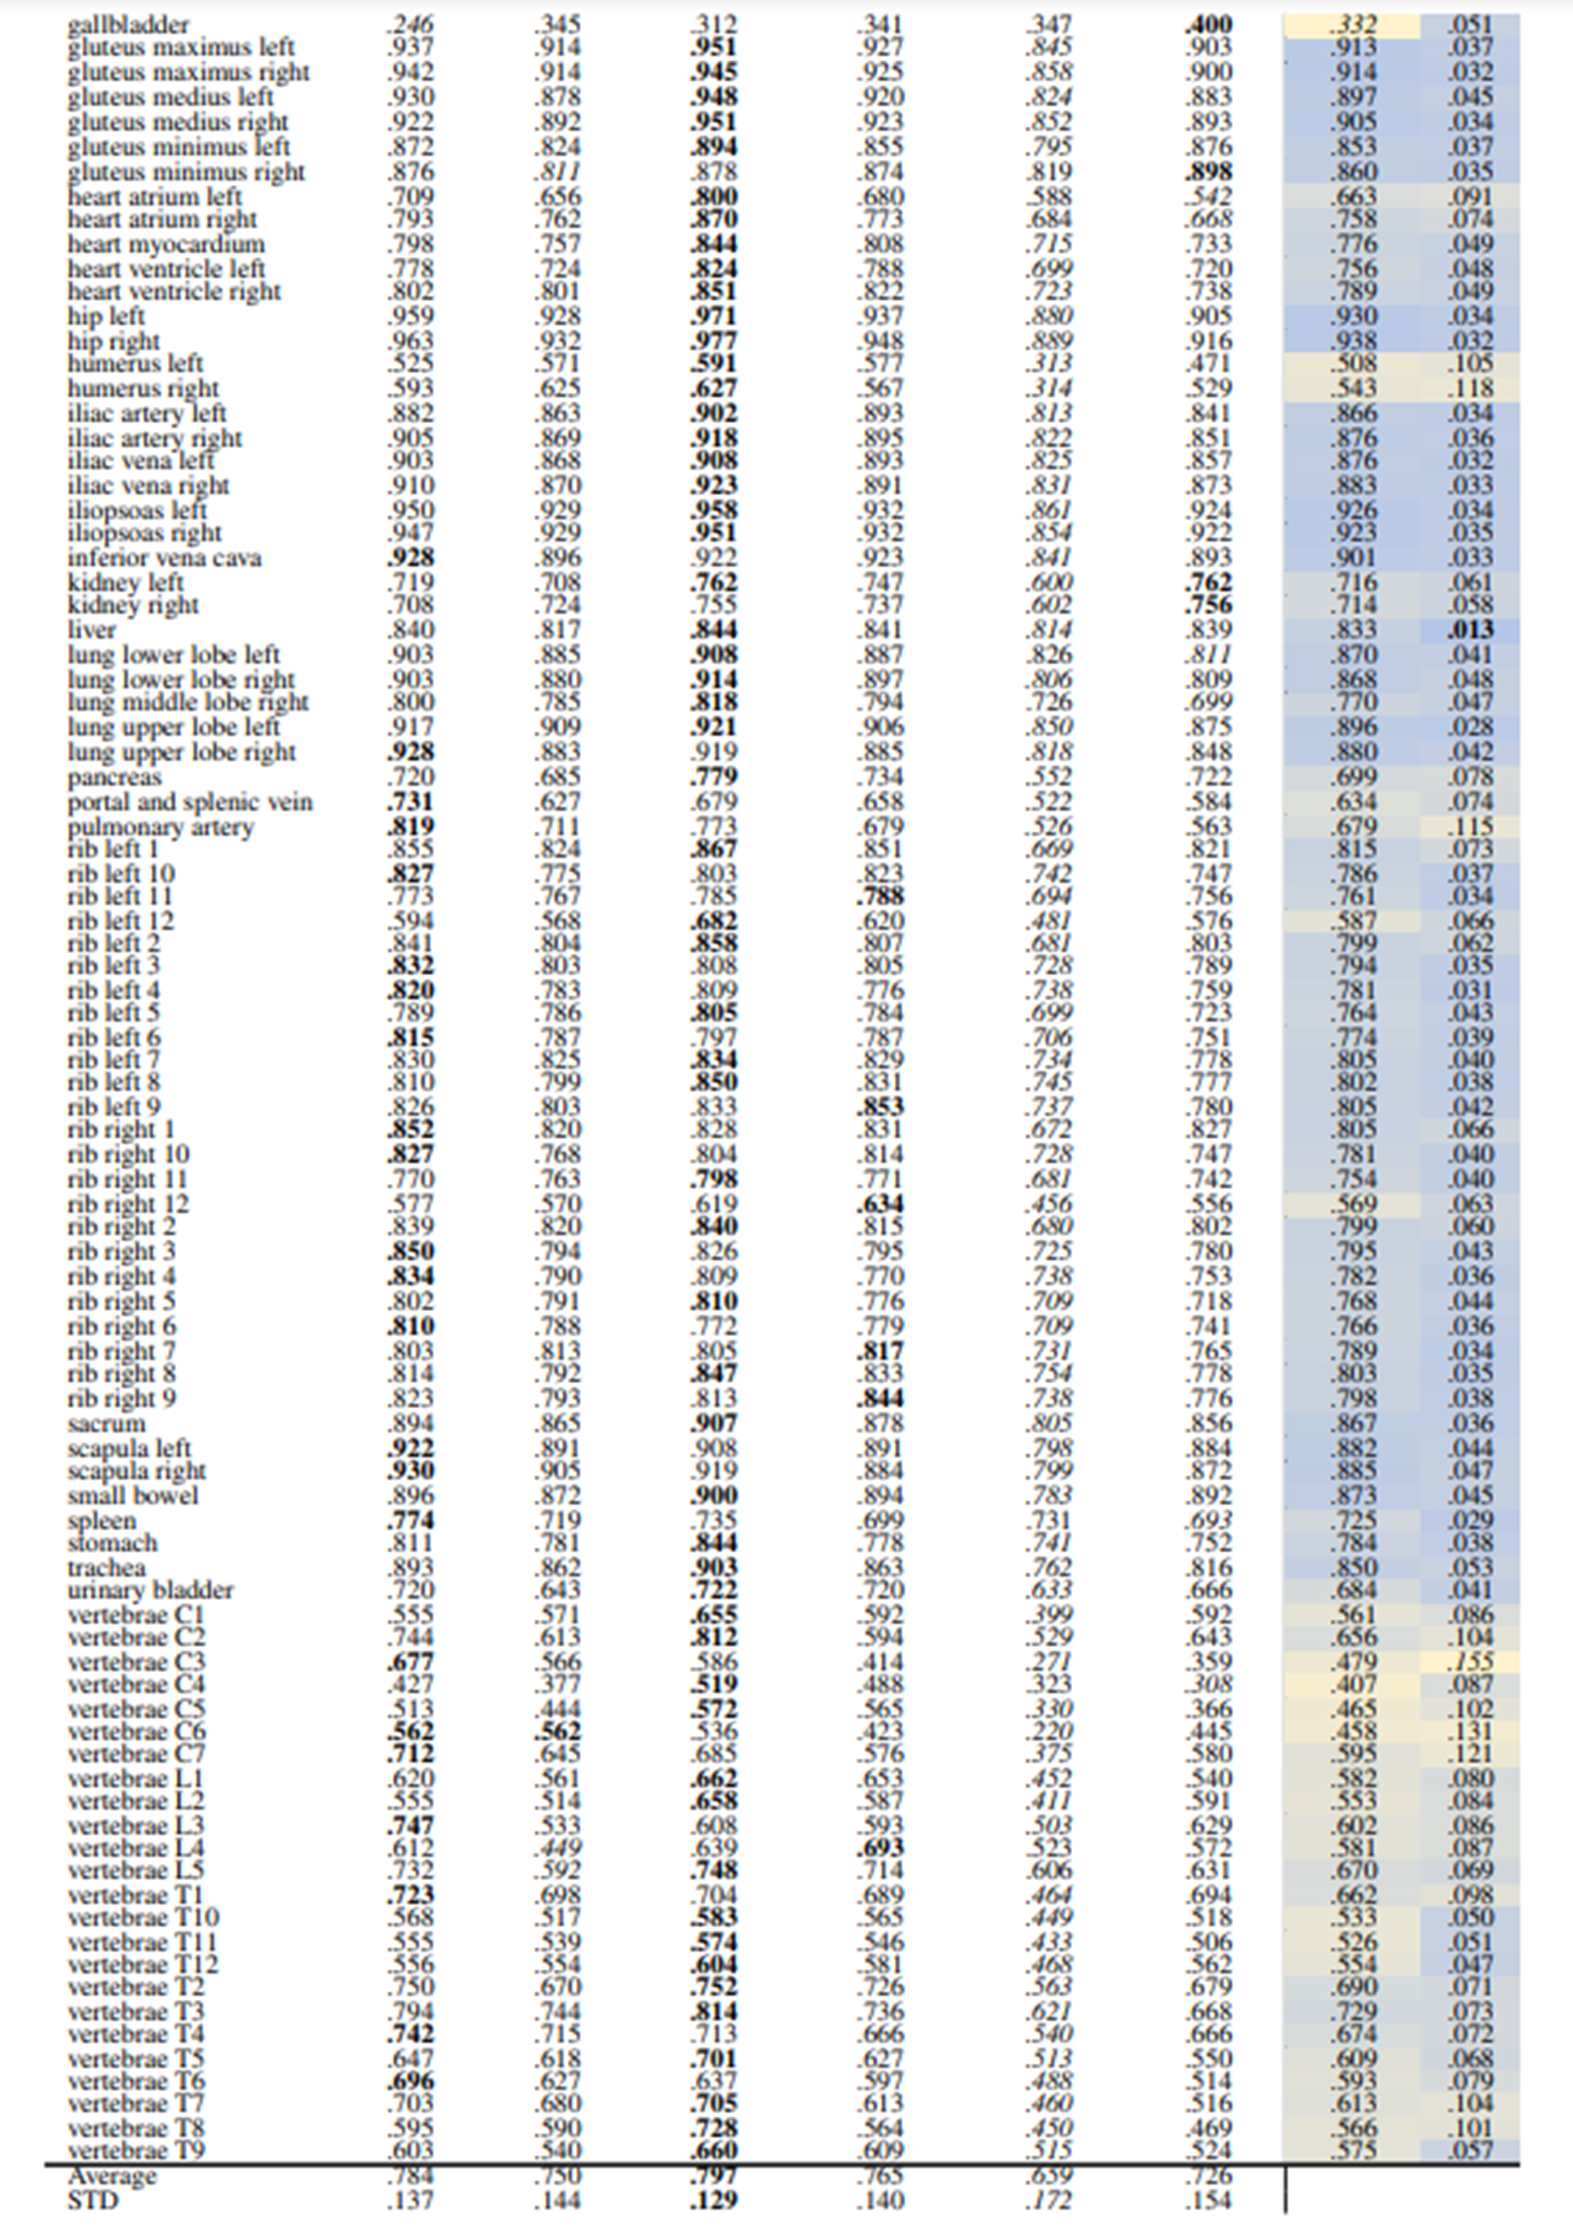
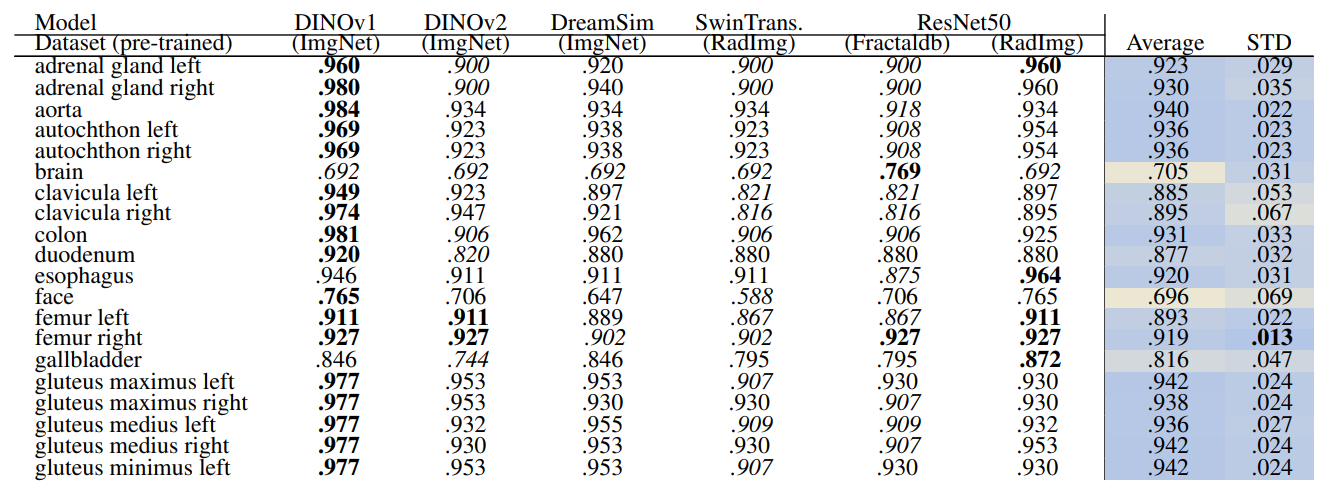
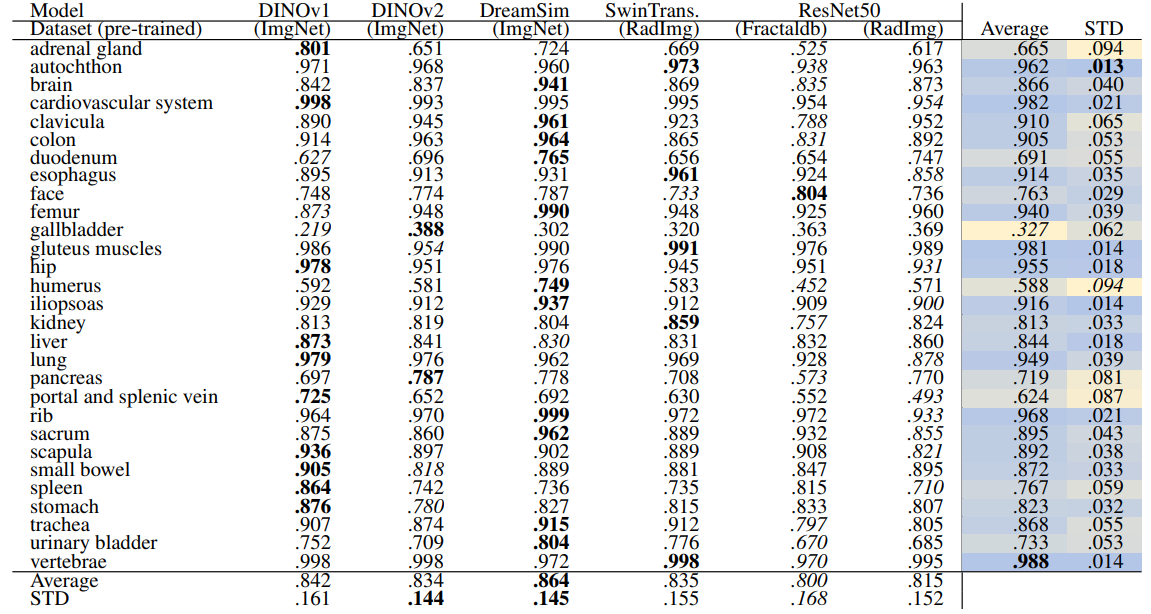
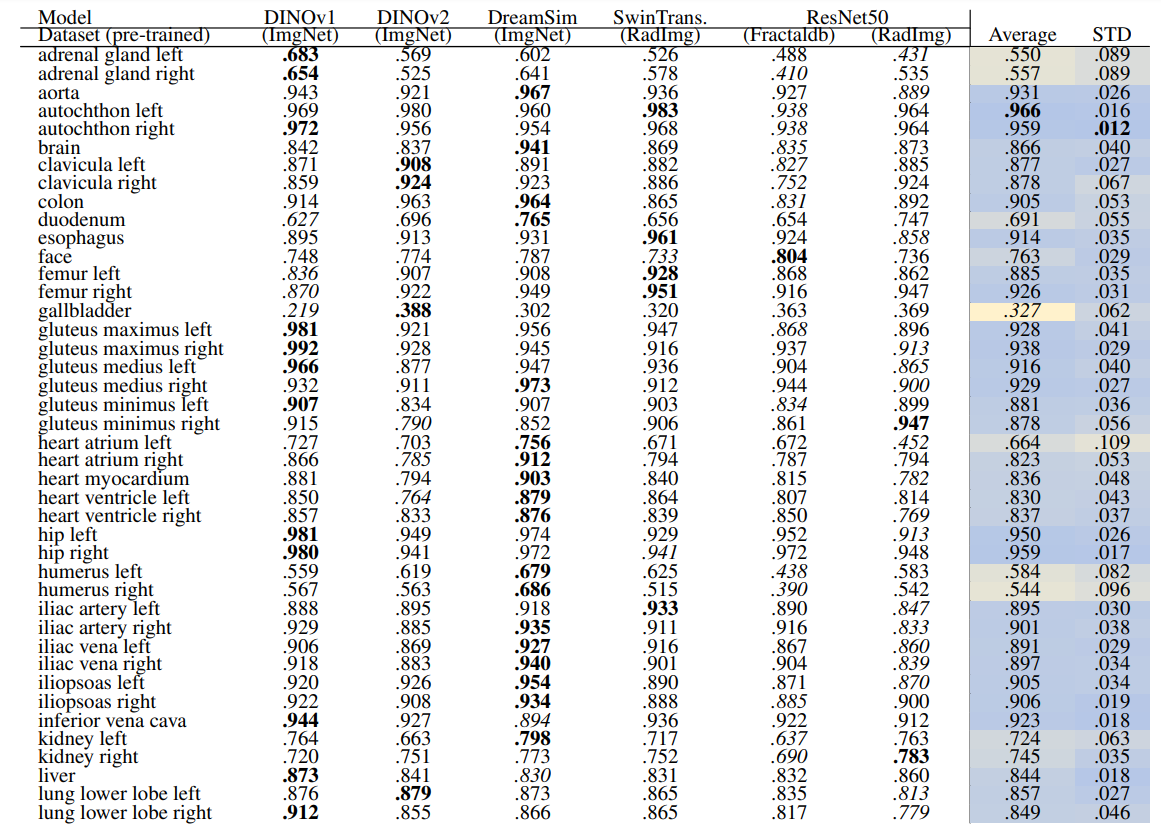
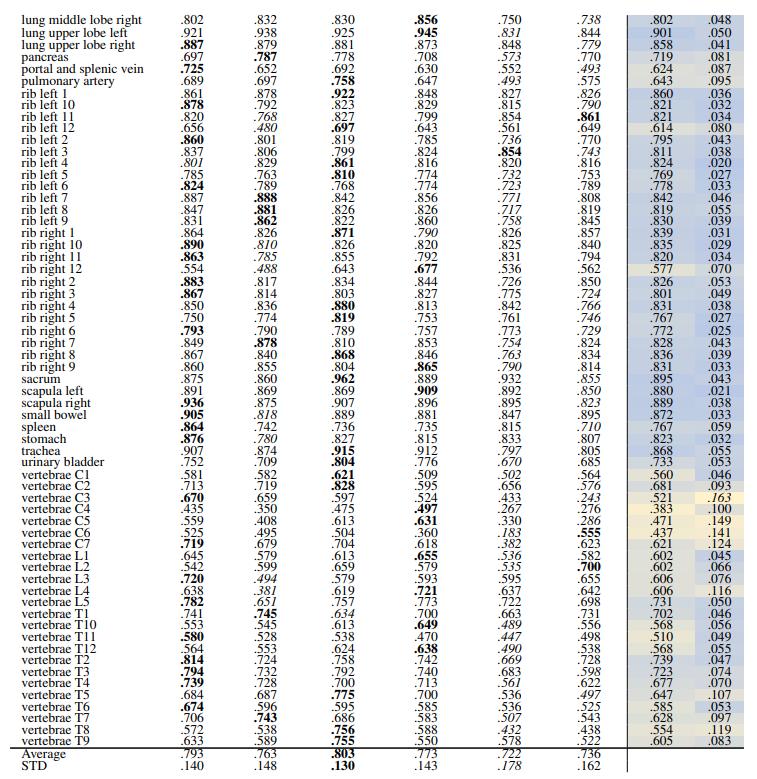
\ Detailed computation of the recall measure for different retrieval methods is explained in Section 2.4. Table 2 and Table 3 show the retrieval recall of 29 coarse anatomical regions and 104 original TS anatomical regions, respectively, using the slice-wise method. The slice-wise recall is considered the lower bound recall because for a perfect recall all the anatomical regions present in the query slice should appear in the retrieved slice.
\ In slice-wise retrieval, DreamSim is the best-performing model with retrieval recall of .863 ± .107 and .797 ± .129 for coarse and original TS classes, respectively. ResNet50 pre-trained on fractal images has the lowest retrieval recall almost on every anatomical region for 29 and 104 classes. This is however expected due to the nature of synthetic generated images.
\ In Table 3 the gallbladder has the lowest retrieval rate followed by vertebrae C4 and C5 (see average column). However, in Table 2 the vertebrae class shows a higher recall which indicated that the vertebrae classes were detected but the exact location, i.e. C4 or C5 were mismatched. The same pattern can be observed in rib classes.
\ 
\ 
\ 
\ 3.1.2 Volume-based
\ This section presents the recall of volume-based retrieval explained in Section 2.4.1 An overview of the evaluation is shown in Figure 2. In volume-based retrieval, per each query volume, one volume is retrieved. In the recall computation, the classes present in both the query and the retrieved volume are considered TP classes. The classes that are present in the query volume and are missing from the retrieved volume are considered FN.
\ Table 4 and Table 5 present the retrieval recall of the volume-based method on 29 and 104 classes, respectively. The overall recall rates are increased compared to slice-wise retrieval which is expected due to the aggregation and contextual effects of neighboring slices.
\ Table 4 shows that ResNet50 trained on RadImageNet outperforms other methods with an average recall of .952 ± .043. However, in Table 5 DINOv1 outperforms all models including ResNet50 with an average recall of .923 ± .077. This shows that the embeddings of finer classes are retrieved and assigned to a different similar class by ResNet50, thus, the performance from fine to coarse classes is improved. Whereas, all the self-supervised methods in Table 5 outperform the supervised methods. Although some models perform slightly better than others based on looking at isolated classes, overall models perform on par.
\ 
\ 
\ 
\ 3.1.3 Region-based
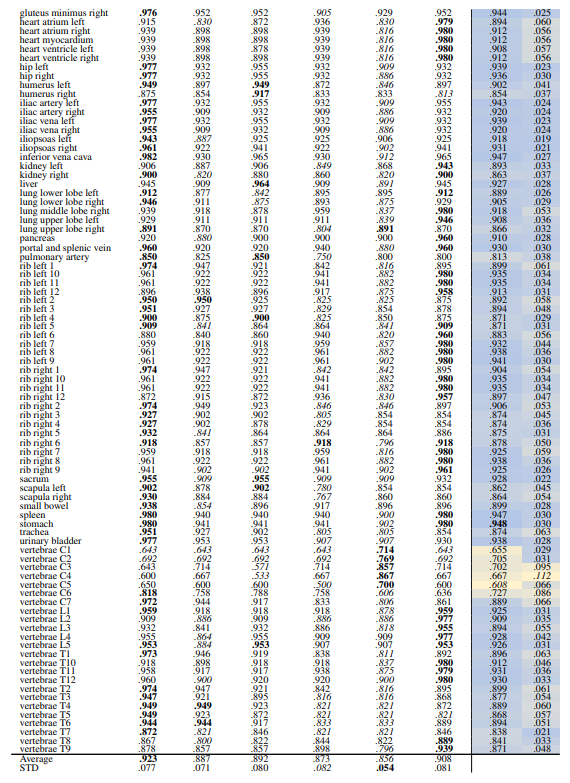
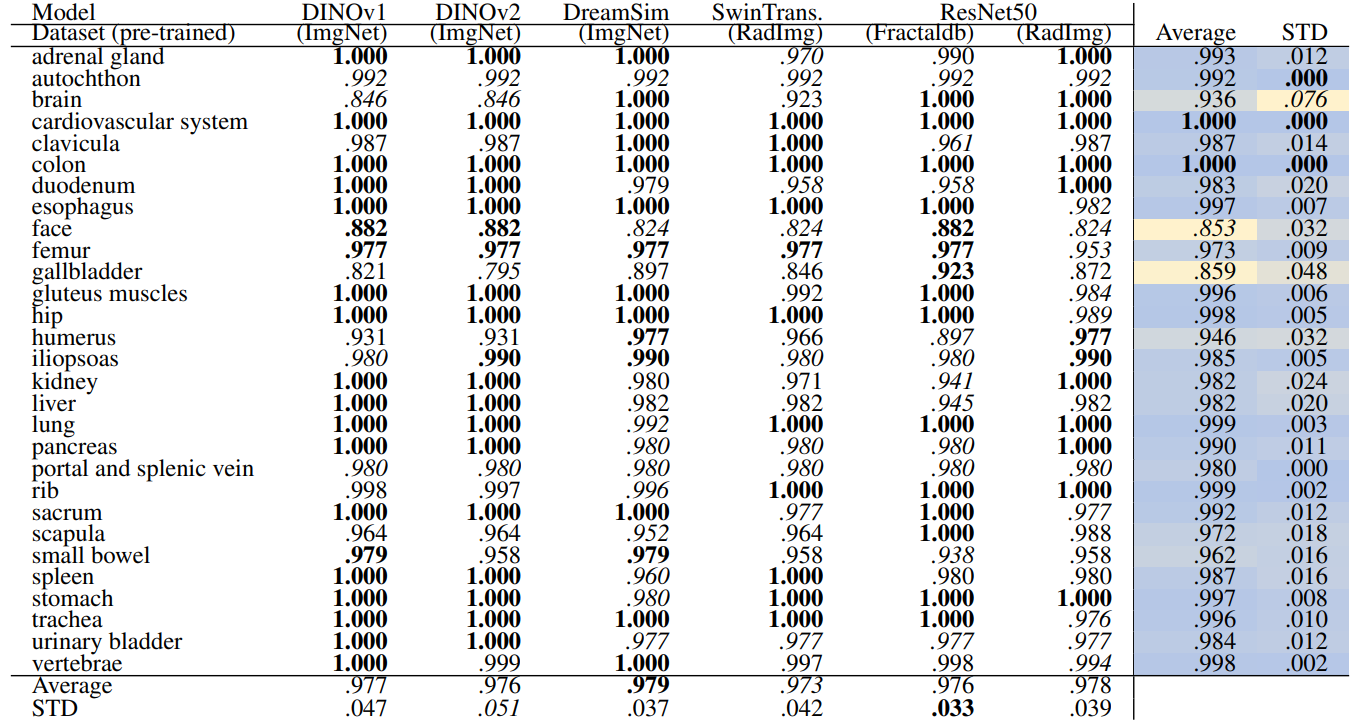
\ This section presents the recall of region-based retrieval. An overview of the evaluation is shown in Figure 3. In regionbased retrieval, per each anatomical region in the query volume, one volume is retrieved. In the recall computation, the classes present in both the sub-volume of the query and the corresponding retrieved volume are considered TP classes. The classes that are present in the query sub-volume and are missing from the retrieved volume are considered FN.
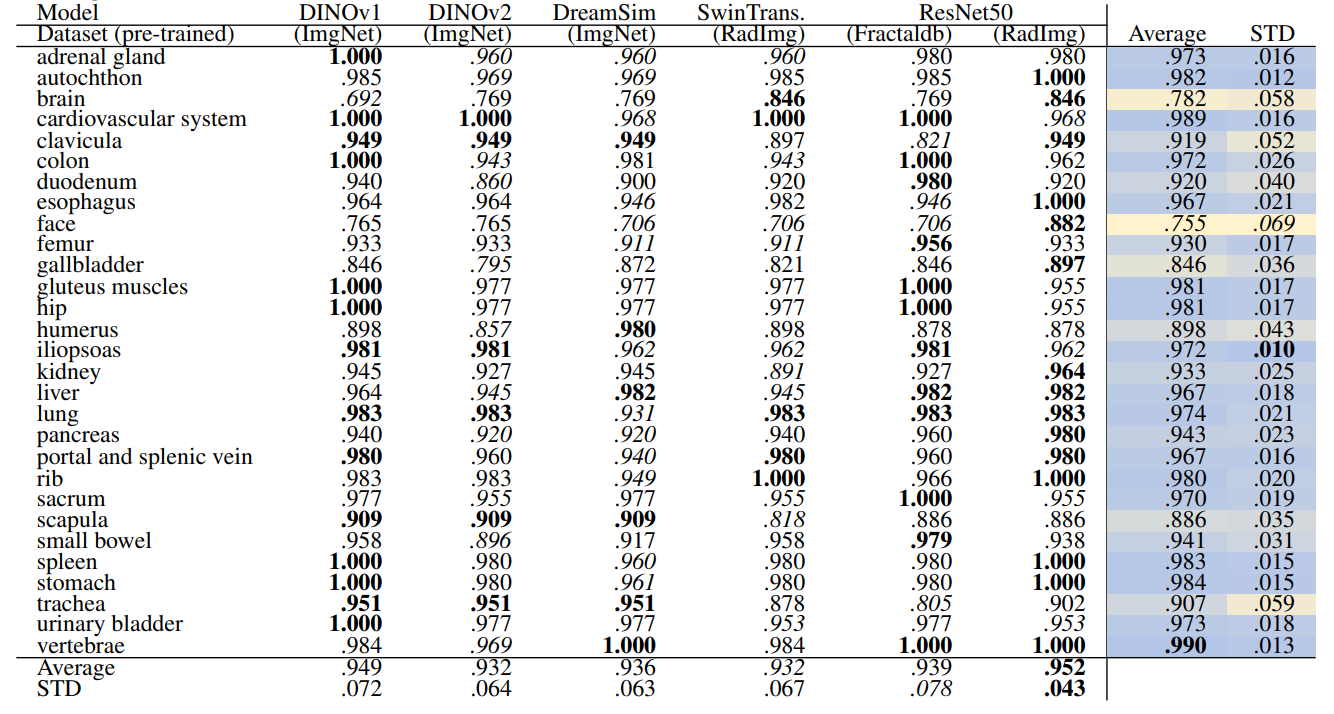
\ Table 6 and Table 7 present the retrieval recalls. Compared to volume-based retrieval the average retrieval for the regions is higher. The performance of the models is very close. DreamSim performs slightly better with an average recall of .979 ± .037 for coarse anatomical regions and .983 ± .032 for 104 anatomical regions. The retrieval recall for many classes is 1.0. The standard deviation among classes and the models is low, with the highest standard deviation of .076 and .092, for coarse and fine classes respectively.
\ 
\ 
\ 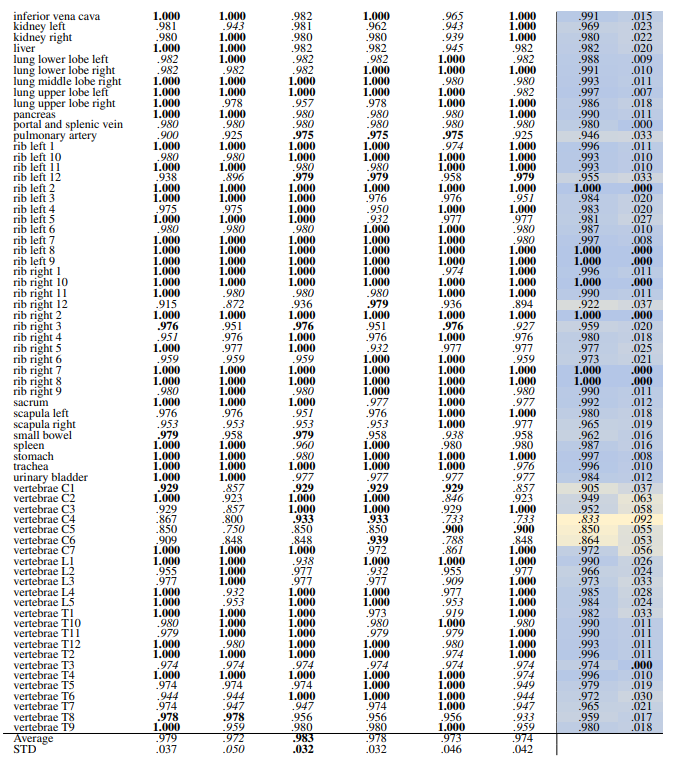
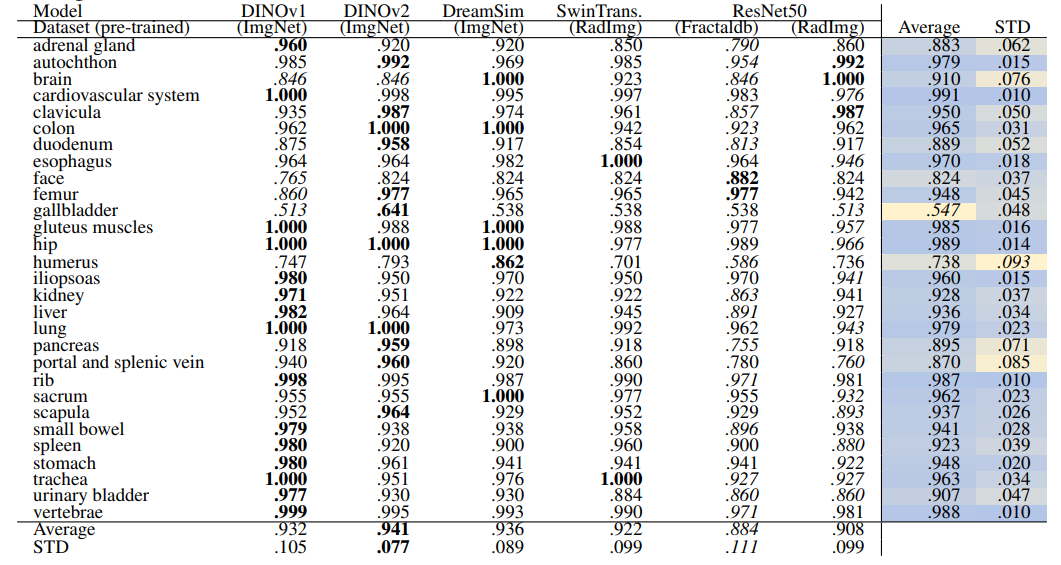
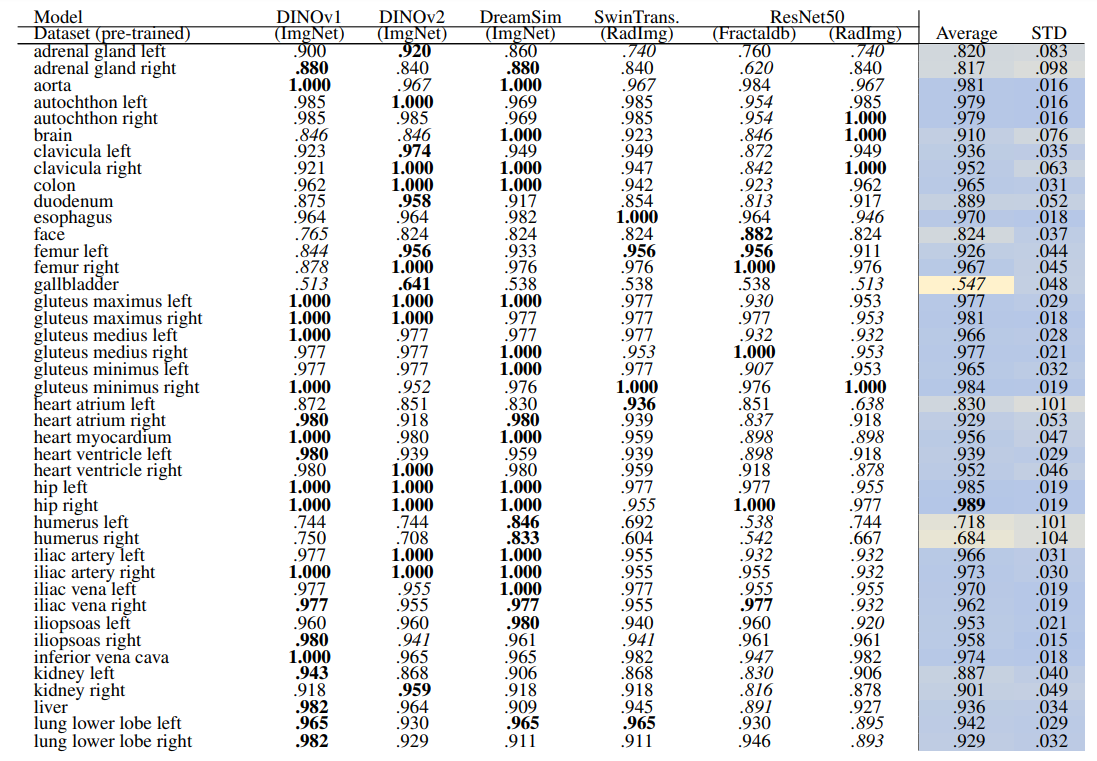
\ 3.1.4 Localized
\ This section presents the recall and localization-ratio of localized retrieval. An overview of the evaluation is shown in Figure 4. In localized retrieval, per each anatomical region in the query volume, one volume is retrieved.
\ Localized Retrieval Recall The recall calculation for localized retrieval is explained in Section 2.4.3 and an overview is shown in Figure 4. Table 8 and Table 9 present the retrieval recalls. Compared to region-based retrieval the average retrieval for regions is lower which is expected based on the more strict metric defined. The performance of models is close, especially the self-supervised models. DINOv2 performs best for 29 anatomical regions with an average recall of .941 ± .077. For 104 regions the performance of models is even closer with DINOv1 performing slightly better with an average recall of .929 ± .085.
\ 
\ 
\ 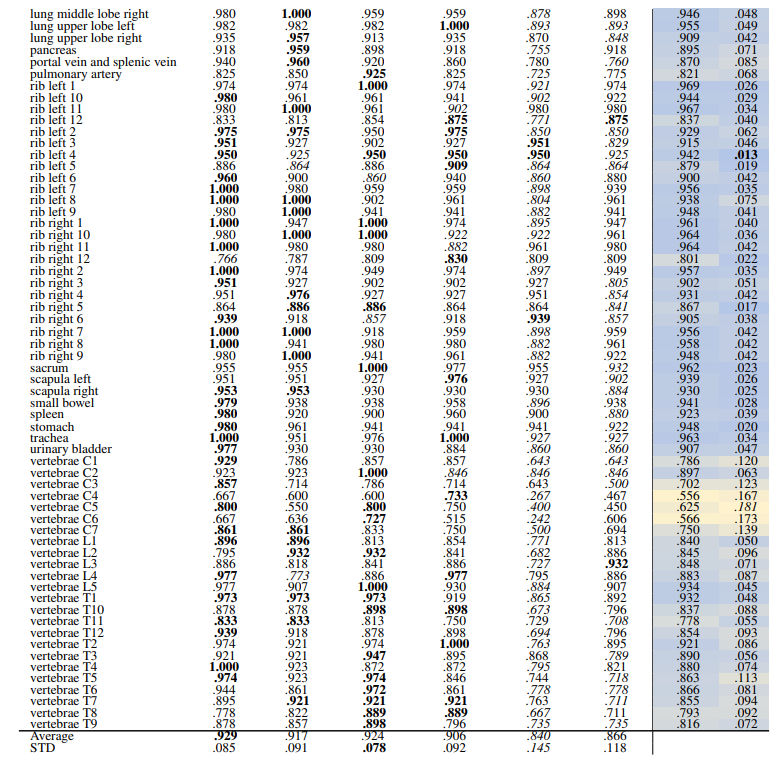
\ Localization-ratio The localization-ratio is computed based on (2). This measure shows how many slices that contributed to the retrieval of the volume actually contained the desired organ. Table 10 and Table 11 show the localization-ratio for 29 coarse and 104 TS original classes. DreamSim shows the best average localization-ratio with an average localization-ratio of .864 ± .145 and .803 ± .130 for coarse and original TS classes, respectively.
\ 
\ 
\ 
\
:::info Authors:
(1) Farnaz Khun Jush, Bayer AG, Berlin, Germany (farnaz.khunjush@bayer.com);
(2) Steffen Vogler, Bayer AG, Berlin, Germany (steffen.vogler@bayer.com);
(3) Tuan Truong, Bayer AG, Berlin, Germany (tuan.truong@bayer.com);
(4) Matthias Lenga, Bayer AG, Berlin, Germany (matthias.lenga@bayer.com).
:::
:::info This paper is available on arxiv under CC BY 4.0 DEED license.
:::
\

You May Also Like

Tom Lee’s BitMine Hits 7-Month Stock Low as Ethereum Paper Losses Reach $8 Billion

Headwind Helps Best Wallet Token
