

Bitcoin Death Cross Is Coming: Don’t Be Fooled By The Name
Bitcoin is days from printing another daily “death cross” — the 50-day simple moving average slipping beneath the 200-day — but analyst Kevin (Kev Capital TA) argues the label misleads more than it informs.
In a November 12 video breakdown titled “BTC Daily Death Cross — How It Works And What To Expect,” he contends that every daily death cross of this cycle has coincided with the late stages — and, in practice, the lows — of multi-month corrective phases. “Don’t fall for the posts that say, ‘Oh my god, death cross on the daily, we’re going down 80%.’ That’s not how these have played out,” he says. “Remember, moving averages are lagging indicators […] the move that caused the cross has already occurred.”
What The Bitcoin Death Cross Means
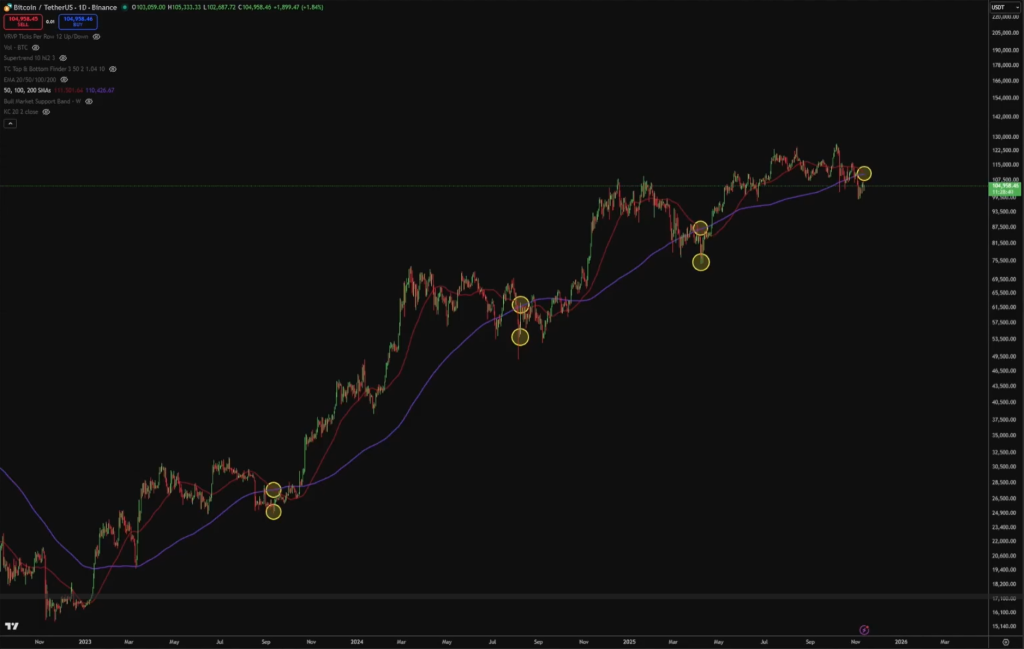
The framing is data-driven and distinctly cyclical. This market, he stresses, has not behaved like 2017 or 2020–2021, when vertical advances never allowed the 50-day to undercut the 200-day during the advance. Instead, 2023–2025 has featured long pauses of 114 to 174 days, with price grinding sideways-to-down before pushing higher again.
Each of those pauses bent the 50-day lower long enough for a cross, and each cross clustered near the end of the corrective window. “This cycle we have seen these consistent, right, 150, 160-plus days of corrective periods […] and with that causes the moving averages to act differently,” he says.
Kevin revisits the three prior crosses. In 2023, after the brutal post-$30k range that followed the breakout from bear-market lows, the death cross “marked the lows […] basically the end of the correction.” Bitcoin chopped for roughly a month, then embarked on what he calls “the biggest rally of the cycle,” carrying from roughly $25k to $73k as altcoins “went berserk […] 5x to 8x, some 10x.”
The 2024 instance came after the mid-cycle top in March and a year-long grind into the US election window. A single “16% candle on one day” stabbed into the lows a few days before the cross; the cross itself arrived after the damage, followed by two months of chop and then a Q4 recovery bid amid “the election exuberance” and a “dovish” turn in Fed rhetoric, pushing Bitcoin “to about $110k.”
The third case, in Q1 2025, was even cleaner. As markets corrected from late-December/early-January peaks amid tariff fears and froth, the 50-under-200 print “literally marked the bottom of the correction,” with an immediate recovery. He characterizes 2025 as a year of reclamation rather than expansion: “We barely made a new all-time high […] that’s just kind of been 2025 in a nutshell,” which explains “why sentiment is just so bad.”
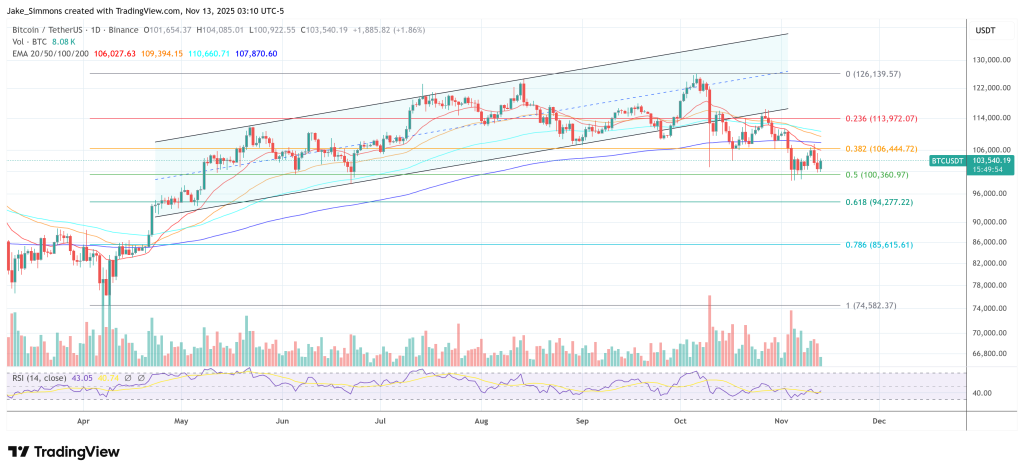
The core mechanism is lag. Because the 50- and 200-day SMAs average past prices, their cross reflects a move already completed. “Almost 100% of the time when a death cross occurs, you do get a retrace back up into your moving averages,” Kevin says, adding that the key question is whether Bitcoin’s bounce merely tags that cluster or reclaims it with authority.
He highlights a specific line in the sand: “Can it reclaim the $106.8k level on weekly closes? If Bitcoin can reclaim its daily moving averages […] and its $106.8k level on weekly closes, Bitcoin should have the opportunity at making a new all-time high.” Failure would argue that “the four-year cycle just played out normally and Bitcoin just had a really weak cycle,” with altcoins never delivering a classic “alt season.”
What Comes Next For BTC?
The analyst leans into the present confusion. He notes a schism among four-year-cycle adherents over whether the clock should be measured from the bottom or from the halving, and he points to evidence of distribution from long-term holders: “Whales that have been holding since the Satoshi era [are] offloading their Bitcoin.” Even so, he frames spot resilience as non-trivial: “Pretty surprised that Bitcoin is still hanging around at $105k given the fact that it’s had that much sell pressure […] back in earlier days when Bitcoin was topping out and whales were offloading, Bitcoin was going through 50% corrections.”
The broader macro backdrop is part of the story. This has been “a restrictive monetary policy environment where liquidity was being sucked out of the system and rates were just too restrictive,” with AI-led equities absorbing risk flows. “The NASDAQ and S&P have been making new all-time highs for multiple years,” he says, while the Russell “barely broke out to a new all-time high a few weeks ago.” In other words, crypto’s underperformance is not isolated.
What comes next, in Kevin’s view, is a clean market test. The daily death cross is “a day or two away,” likely into the weekend, and traders should expect a response toward the moving averages. The decisive stage is whether price can then clear the stack — “our 200 SMA, our 200 EMA, our 100 EMA, and even this 50 SMA” — and convert the $106.8k weekly close level back into support.
“If we can do that […] Bitcoin absolutely has an opportunity to go make a new high,” he says. “If we can’t […] then obviously things are not going to be looking too good.” He cautions that incoming macro prints and central-bank rhetoric could “throw a wrench into things,” but he returns to the same empirical anchor: “This has happened three times this cycle already. Here’s exactly how the data works. Here’s what’s happened.”
The punchline is less apocalyptic than the name implies. Four death crosses in one cycle is unprecedented for Bitcoin during an advance, and the last three coincided with late-stage corrective lows rather than trend collapses. As Kevin puts it: “The death cross everyone fears has marked every bottom so far.” The signal that “refuses to kill Bitcoin” is set to flash again; the pathology of the move afterward — rejection at the averages versus a decisive reclaim and weekly hold above $106.8k — will tell the real story.
At press time, BTC traded at $103,540.
You May Also Like

Japan-Based Bitcoin Treasury Company Metaplanet Completes $1.4 Billion IPO! Will It Buy Bitcoin? Here Are the Details


45,000 ETH Daily Exodus Shakes Market
