Bitcoin Holds Key 78K Retest As Traders Eye Next Move Toward 95K Zone
Bitcoin holds the key $78K retest after a 35% rally, as traders watch $82K resistance and the $93K–$95K target zone.
Bitcoin traded near the key $78,000 level as traders watched a fresh retest after a 35% advance from $61,000 to $82,800.
The Bitcoin price action has placed the market at a closely tracked area on the 3-day chart.
Market analysts are now watching whether BTC can hold this zone and build toward the $93,000 to $95,000 resistance area.
Bitcoin Price Retests Key $78K Support
Bitcoin was trading around $77,972 on the daily BTC/USD chart, according to the shared market view. The move followed a strong rebound from the $61,000 area to $82,800.
The latest pullback has brought BTC back to the $78,000 level. This zone has acted as a key reference area several times since early 2025.
Traders described the move as a normal retest after a 35% advance. A pullback after a large rally can test buyer strength and market structure.
The rising trendline from the February lows remains intact on the chart. Price is also sitting near the yellow support area, which traders are watching closely.
One market analyst stated, “As long as we hold $78K on a close, the structure stays intact.” The same view said this area could form a higher low.
Traders Watch $93K to $95K Resistance Zone
The next upside area watched by traders is the grey zone between $93,000 and $95,000. This range has rejected Bitcoin twice on the chart.
A clean move into that area would test a key resistance level. A break above it could change the wider BTC market structure for this cycle.
Before that level, Bitcoin faces near-term resistance around $80,000 to $82,000. A daily close above that zone could support another move higher.
The next area sits near $88,000 to $92,000. This zone includes prior breakdown levels and diagonal resistance on the chart.
Bitcoin has not yet confirmed a fresh uptrend on the higher time frame. The current move remains a recovery attempt after a sharp decline from earlier highs.
Read Also:
BTC Momentum Indicators Remain Mixed
The MACD panel shows that downside momentum has eased from recent lows. However, the histogram remains negative, which shows that buyers have not fully taken control.
The MACD reading is near 932, while the signal line is near 1,465. The histogram stands around minus 533 on the chart.
The RSI is near 48.32, which places Bitcoin close to neutral territory. Its moving average is near 60.48, so momentum remains uneven.
A move above the 50 to 55 RSI range would improve the short-term setup. A rejection under that area could show weaker demand.
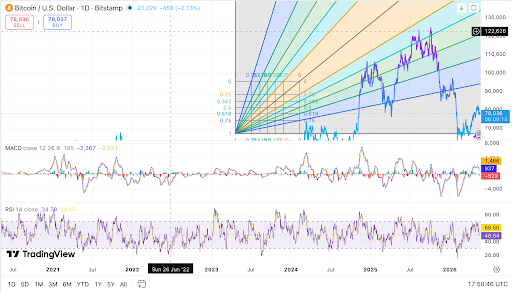 Bitcoin retests $78K support as traders watch $95K resistance. Source: TradingView
Support below $78,000 is seen near $75,000 to $76,000. A daily close below that level could expose $68,000 to $70,000.
The wider support area remains near $60,000 to $63,000. A loss of that zone would weaken the current Bitcoin price recovery.
For now, traders are focused on the $78,000 close. Holding that level keeps attention on a possible BTC move toward $95,000.
The post Bitcoin Holds Key 78K Retest As Traders Eye Next Move Toward 95K Zone appeared first on Live Bitcoin News.


Ayrıca Şunları da Beğenebilirsiniz

Bitcoin Social Euphoria Hits Yearly High Amid CLARITY Act Buzz

How Will XRP Price React After the FOMC Meeting Today?