

Bitcoin price falls under $77K as ETFs record $1B outflows
U.S. spot Bitcoin ETFs recorded more than $1 billion in cumulative net outflows over the past week as institutional investors reduced exposure to the asset.
- U.S. spot Bitcoin ETFs recorded over $1 billion in cumulative net outflows last week as institutional demand for crypto exposure weakened sharply.
- Bitcoin fell below the $77,000 support level after over $661 million in crypto liquidations wiped out heavily leveraged bullish positions.
- Rising inflation concerns and WTI crude prices above $107 added pressure on risk assets as traders reduced expectations for Fed rate cuts.
According to data from SoSoValue, the latest withdrawals mark a sharp reversal after several weeks of strong inflows that had previously helped support Bitcoin’s recovery above the $80,000 region earlier this month.
Spot Ethereum ETFs also remained under pressure, extending their recent streak of daily net outflows with $255 million exiting the funds last week as institutional appetite across the broader crypto market weakened further.
The latest outflows coincided with a broader market decline that pushed Bitcoin (BTC) below the key $77,000 psychological support level on Monday. BTC fell more than 4% over the past 24 hours, dropping from recent highs near $82,000 to an intraday low around $76,500 before stabilizing slightly near $77,000 at press time.
According to CoinGlass data, more than $661 million worth of crypto positions were liquidated over the past 24 hours, with bullish long positions accounting for nearly 95% of the wipeout.
Bitcoin’s decline also came as rising inflation concerns and elevated oil prices weakened appetite for speculative assets.
Recent Producer Price Index data surged 6% year-over-year following a stronger-than-expected Consumer Price Index reading of 3.8%, reinforcing fears that the Federal Reserve may keep interest rates elevated for longer than previously expected.
Meanwhile, WTI crude futures climbed above $107 per barrel after stalled U.S.-Iran negotiations and continued Strait of Hormuz disruptions fueled broader inflation concerns across global markets.
Higher interest rates typically reduce market liquidity and increase the attractiveness of safer fixed-income investments relative to volatile assets such as cryptocurrencies.
Despite the recent selloff, Bitcoin’s broader medium-term structure remains relatively constructive on the daily chart.
Bitcoin price has now fallen back below the key $80,000 psychological support region after facing rejection near the $82,000–$84,000 resistance zone earlier this month.
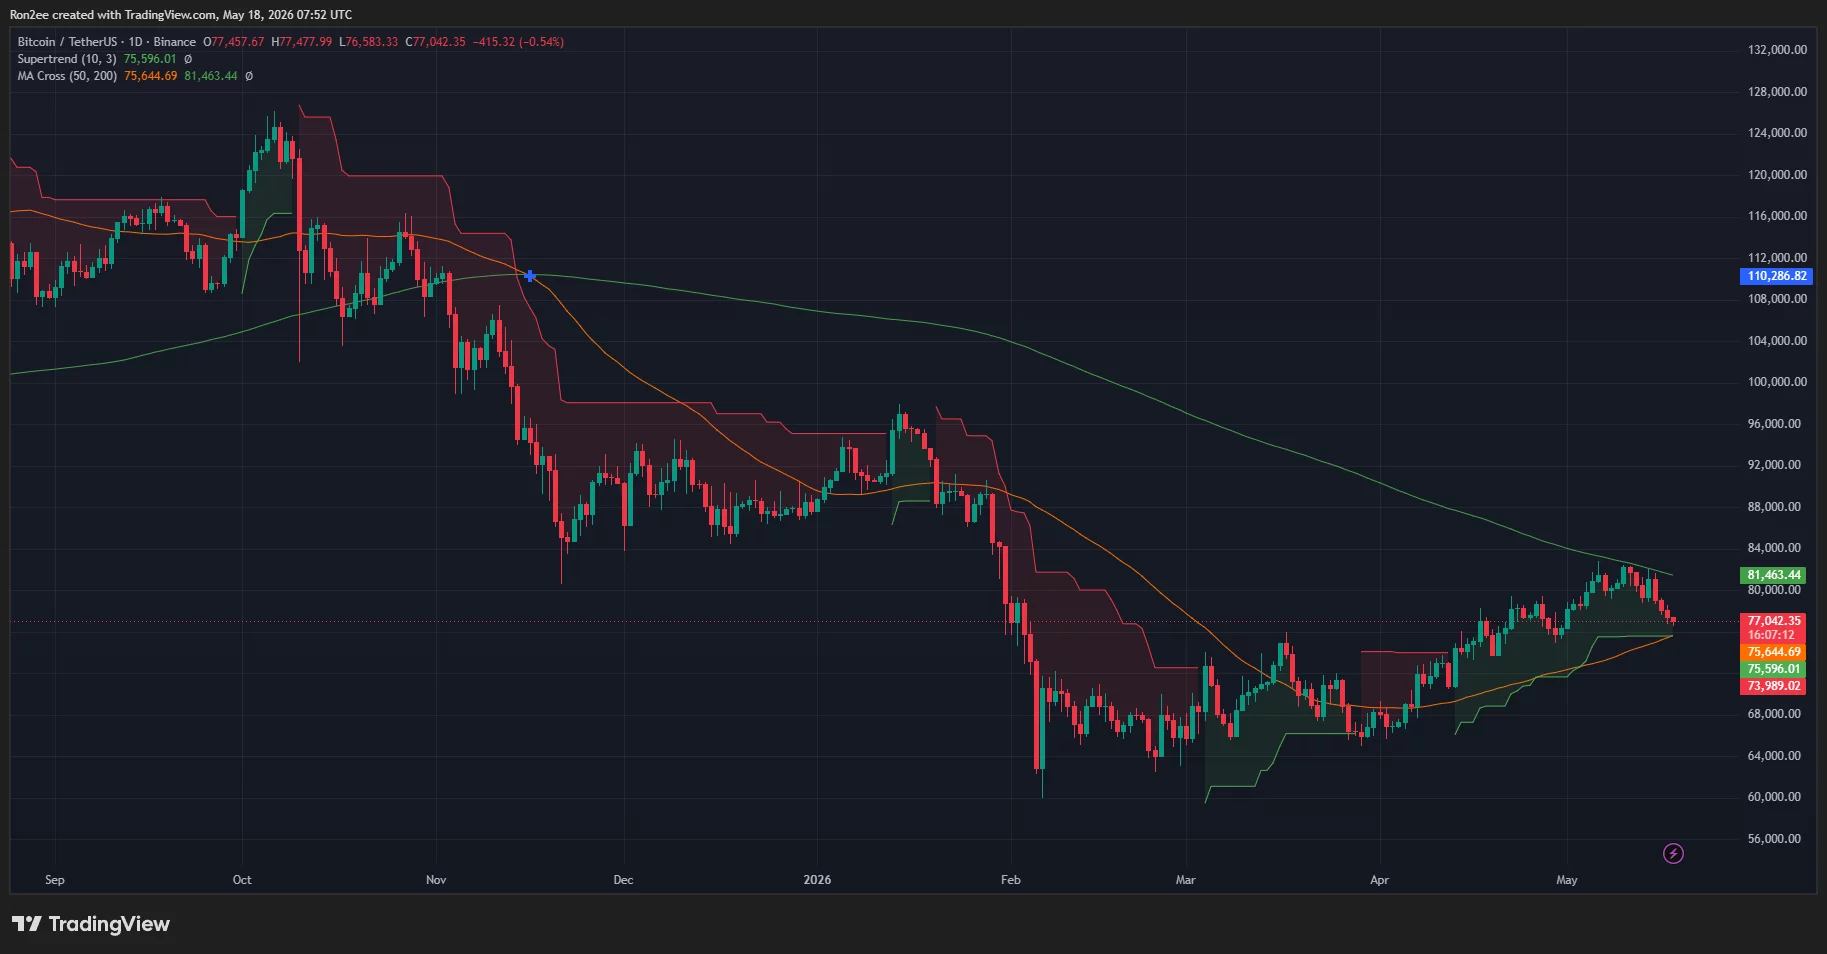
Despite the latest pullback, BTC continues holding above its 50-day simple moving average near $75,500, while the Supertrend indicator also remains bullish around the same region, suggesting that the broader medium-term uptrend structure remains intact for now.
Meanwhile, the 50-day SMA continues approaching a potential bullish crossover above the 200-day SMA near $81,400, forming what traders commonly refer to as a golden cross.
However, short-term momentum has weakened following the latest selloff, with Bitcoin now struggling to reclaim the $80,000 level.
If bulls manage to push BTC back above $80,000, the token could soon attempt another move toward the broader resistance cluster between $81,400 and $84,000.
On the downside, failure to hold above the current support structure could expose Bitcoin to a deeper correction toward the $75,500–$73,900 region, where both the 50-day SMA and Supertrend support currently converge.
Disclosure: This article does not represent investment advice. The content and materials featured on this page are for educational purposes only.


Ayrıca Şunları da Beğenebilirsiniz

Trillion-Dollar Italian Bank Moves To XRP, But How Much Have They Bought?

ArtGis Finance Partners with MetaXR to Expand its DeFi Offerings in the Metaverse


