Bitcoin Repeating Previous Breakdown Structure—Is BTC Price Headed Toward $55K Next?

The post Bitcoin Repeating Previous Breakdown Structure—Is BTC Price Headed Toward $55K Next? appeared first on Coinpedia Fintech News
Bitcoin continues to trade under mounting long-term bearish pressure as the price struggles to reclaim crucial resistance zones after losing a major market structure earlier this year. Although the BTC price managed to trigger a short-term rebound from the recent lows, the broader weekly structure still resembles the previous breakdown pattern that triggered a nearly 25% correction.
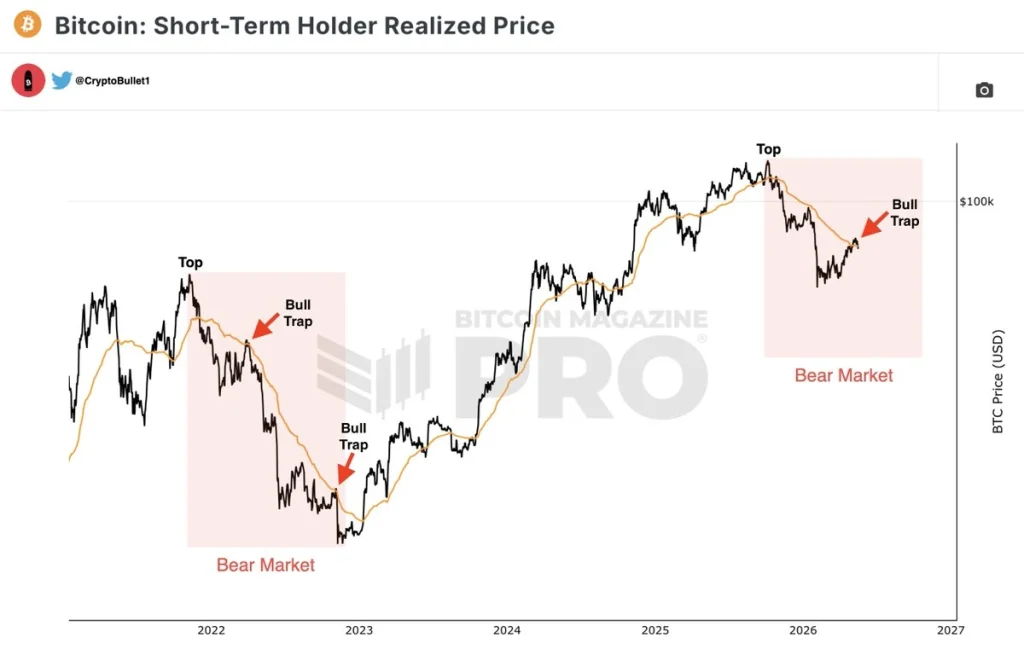
At the same time, concerns are growing across the market after Bitcoin once again moved above the Short-Term Holder Realized Price during an apparent bear-market phase. This setup historically precedes sharp downside moves. With momentum indicators weakening and liquidity inflows fading, traders are increasingly watching whether Bitcoin is preparing for another major leg down toward the $55,000 region.
BTC Price Analysis: Bitcoin Faces a Rejection From Key Levels
As seen in the chart above, the BTC price continues to trade within a developing bear flag structure after facing rejection near the $90,000 resistance zone. The recent recovery attempt failed to reclaim the upper resistance trend line, while the price has now slipped back below the mid-range support near $76,000. The structure closely resembles the previous breakdown pattern that led to a sharp 25% decline, suggesting bearish continuation may prevail.
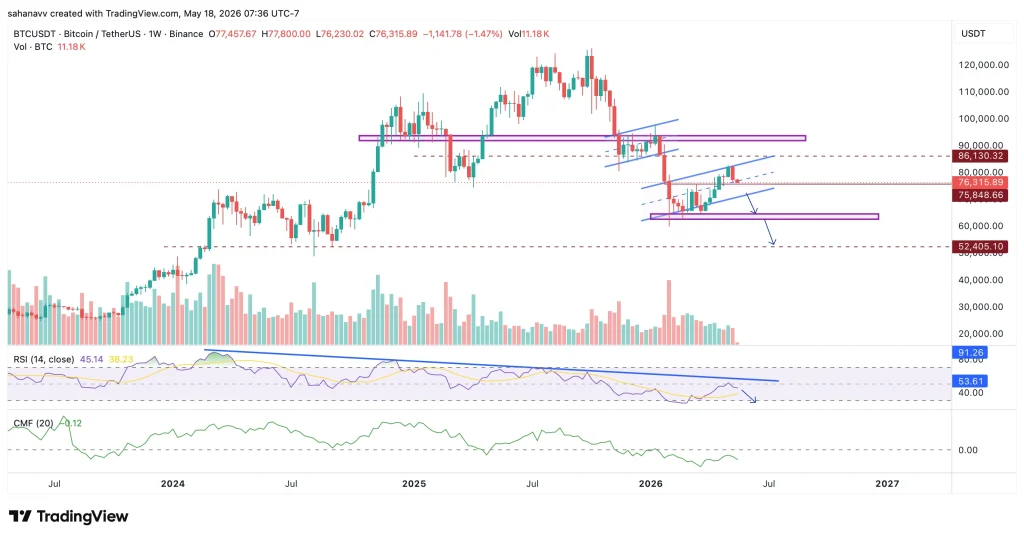
The RSI on the weekly timeframe continues to trend lower while printing a long-term bearish divergence, signaling weakening momentum across the broader cycle. Meanwhile, the CMF remains close to neutral-to-negative territory, indicating liquidity inflows continue to weaken. The immediate support now stands near $72,000, which aligns with the lower support of the bear flag pattern. This level remains extremely critical for the bulls, as a strong rebound from this range could invalidate the current bearish setup.
However, if BTC loses this support zone, the breakdown could accelerate toward the next major support near $55,000. On the upside, the immediate resistance stands near $86,000, followed by the major resistance zone around $90,000 to $92,000.
Bitcoin Reclaims Short-Term Holder Realized Price—Bull Trap Ahead?
The chart highlights a recurring historical pattern tied to Bitcoin’s Short-Term Holder Realized Price, which often acts as a decisive market sentiment indicator during bearish cycles. In previous bear markets, BTC briefly reclaimed this level, triggering temporary optimism and aggressive long positioning before the rallies ultimately turned into bull traps and led to steep corrections.
 Source: X
The current market structure appears to be mirroring a similar setup, with Bitcoin once again moving above the realized price after a major correction from the cycle highs. This suggests the latest rebound could be driven more by short-term speculative relief rather than strong long-term accumulation. If history repeats, Bitcoin may continue to face heavy selling pressure near resistance levels before another broader decline unfolds.
Key Levels to Watch
- Immediate Support: $72,000
- Major Breakdown Target: $55,000
- Immediate Resistance: $86,000
- Major Resistance Zone: $90,000 to $92,000
- Bullish Invalidation Level: Strong rebound from $72,000
Is Bitcoin Preparing for Another Major Breakdown?
The broader Bitcoin structure continues to favor the bears as the current recovery increasingly resembles the previous breakdown pattern that triggered a steep market correction. Weakening momentum indicators, fading liquidity strength, and repeated rejection from key resistance zones continue to support the bearish outlook. Unless BTC manages to reclaim the bear flag resistance and sustain above $86,000, the possibility of a deeper correction toward $55,000 is likely to remain dominant in the coming weeks.


Ayrıca Şunları da Beğenebilirsiniz
Pi Coin Price Crashes Another 7.5% Before Pi Network Protocol 23 Mainnet Activation

The Chemistry of UV Resistance: How Titanium Dioxide Protects Against the California Sun