BTC Faces Lower High Risk as Market Braces for Possible Deeper Pullback Soon
Bitcoin trades near $76,900 as lower high risk grows, with $80K–$82K resistance and $73K–$75K support in focus.
Bitcoin is trading near $76,900 as analysts watch a possible lower high on the daily chart.
The setup has placed BTC price action under fresh attention, since the market remains below key recovery levels after a sharp drop from above $120,000.
Bitcoin Price Trades Below Key Resistance
Bitcoin’s daily Bitstamp chart shows price moving near the lower area of a large trend structure.
BTC has recovered from the $65,000 to $70,000 zone, where buyers recently entered the market.
However, the rebound has not yet cleared major resistance. The $80,000 to $82,000 area remains the nearest zone watched by analysts.
A daily close above that area could support a move toward $88,000 to $92,000. That range acted as a previous trading zone, and sellers may return there.
Market analysts warned that Bitcoin may be forming a high time frame lower high. One trader said BTC is entering “a very dangerous zone” as price nears resistance.
A lower high would show that buyers failed to regain control. It could also keep the broader downtrend active in the short term.
Support Levels Remain Important for BTC
Bitcoin’s first support area sits near $73,000 to $75,000. This zone may decide whether the current bounce can continue.
If BTC falls below that range, traders may watch the $68,000 to $70,000 demand area. That zone helped stop the recent selloff.
A deeper break below $68,000 would weaken the current structure. It could also increase the risk of a larger Bitcoin correction.
The chart also shows Fibonacci fan levels from the cycle low. BTC is trading near the lower retracement area, while stronger upper fan lines remain overhead.
The 0.75 fan area appears close to the current price region. Holding this area may help Bitcoin keep its recovery attempt alive.
Failure to hold that level would place more pressure on the lower support zone. It would also support the lower high risk noted by traders.
Read Also:
MACD and RSI Show Cautious Momentum
Bitcoin momentum remains weak on the daily chart. The MACD stays below the zero line, which shows limited bullish strength.
The MACD histogram is still negative near minus 698. The MACD line is near 418, while the signal line is near 1,116.
This setup shows that sellers still have control of momentum. A bullish crossover has not appeared yet on the chart.
For stronger confirmation, the MACD line would need to cross above the signal line. The histogram would also need to move above zero.
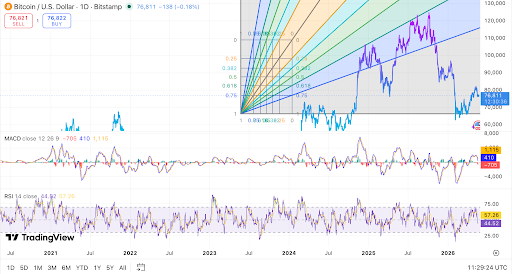 Bitcoin faces lower high risk as $80K resistance caps recovery. Source: TradingView
The RSI is near 44.86, while its moving average is around 57.28. This shows BTC remains below its recent strength average.
The RSI is not in oversold territory, but it is below the neutral 50 level. A move above 50 would show improving momentum.
A move above 60 would give buyers more support. However, a drop toward 35 could show renewed selling pressure.
Bitcoin now faces a key test between resistance and support. A break above $82,000 may improve the outlook, but a fall below $73,000 could extend the pullback.
The post BTC Faces Lower High Risk as Market Braces for Possible Deeper Pullback Soon appeared first on Live Bitcoin News.


Ayrıca Şunları da Beğenebilirsiniz

Robotics Automation Prototyping: Engineering Kinetic Agility into End-Effectors
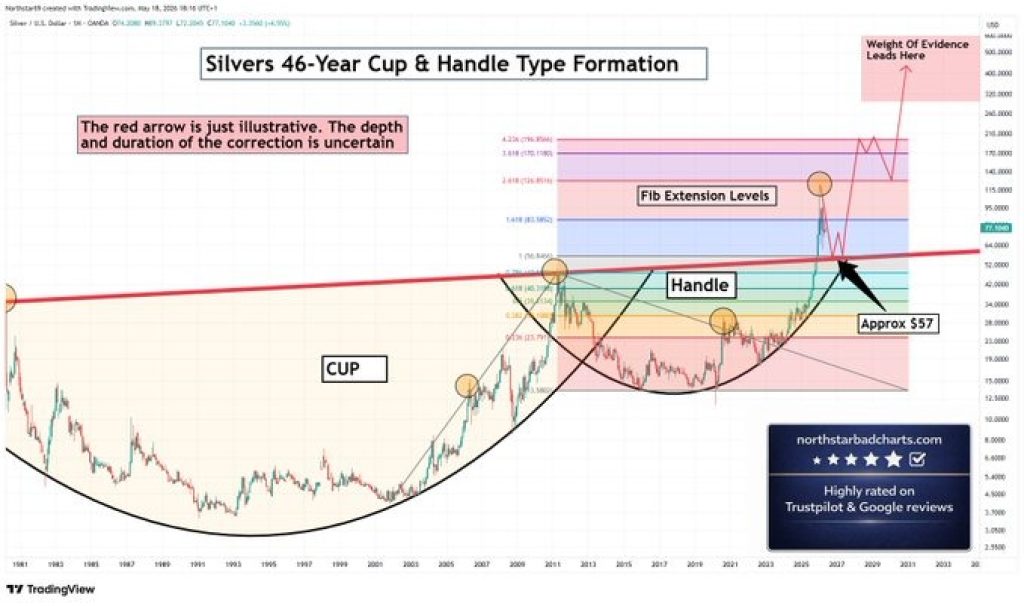
Silver Price Prediction: Cup and Handle Points to $196 – Why the Correction Was Always Part of the Plan