

XRP Price Rebound Faces Trouble, Downside Pressure Starts Building Again
XRP price started a recovery wave above $1.360 and $1.3620. The price is now consolidating and might aim for a fresh move if it clears $1.3940.
- XRP price started a recovery wave above the $1.3620 zone.
- The price is now trading below $1.3850 and the 100-hourly Simple Moving Average.
- There was a break above a declining channel with resistance at $1.380 on the hourly chart of the XRP/USD pair (data source from Kraken).
- The pair could continue to move up if it settles above $1.3940.
XRP Price Eyes Recovery
XRP price remained supported above $1.3450 and started a recovery wave, like Bitcoin and Ethereum. The price was able to climb above $1.3550 and $1.360 to enter a short-term positive zone.
More importantly, there was a break above a declining channel with resistance at $1.380 on the hourly chart of the XRP/USD pair. However, the bears could be active near the $1.3820 zone and the 23.6% Fib retracement level of the downward move from the $1.5495 swing high to the $1.3465 swing low.
The price is now trading below $1.3850 and the 100-hourly Simple Moving Average. If there is a fresh upward move, the price might face resistance near the $1.3850 level. The first major resistance is near the $1.3940 level.
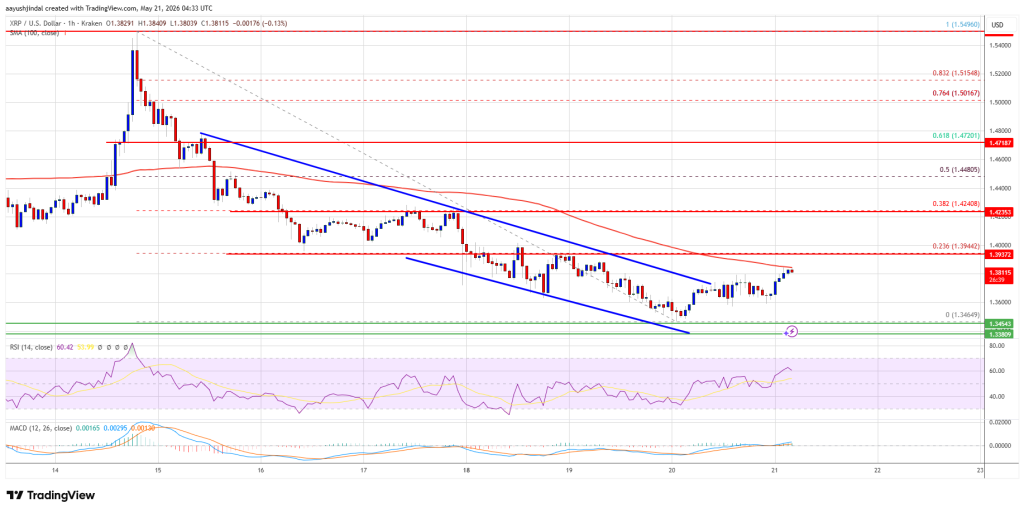
A close above $1.3940 could send the price to $1.420. The next hurdle sits at $1.4720 or the 61.8% Fib retracement level of the downward move from the $1.5495 swing high to the $1.3465 swing low. A clear move above the $1.4720 resistance might send the price toward the $1.50 resistance. Any more gains might send the price toward the $1.520 resistance.
Another Drop?
If XRP fails to clear the $1.3940 resistance zone, it could start a fresh decline. Initial support on the downside is near the $1.3620 level. The next major support is near the $1.3550 level.
If there is a downside break and a close below the $1.3550 level, the price might continue to decline toward $1.3450. The next major support sits near the $1.3350 zone, below which the price could continue lower toward $1.320.
Technical Indicators
Hourly MACD – The MACD for XRP/USD is now gaining pace in the bullish zone.
Hourly RSI (Relative Strength Index) – The RSI for XRP/USD is now above the 50 level.
Major Support Levels – $1.3620 and $1.3450.
Major Resistance Levels – $1.3850 and $1.3940.


Ayrıca Şunları da Beğenebilirsiniz

Bitcoin’s Quantum Vulnerability: Poor Wallet Habits Expose 4.12 Million BTC

Rape joke by Bacolod broadcaster sparks outrage, suspension

SGX FX Partners With Chainlink to Bring OTC FX Data Onchain


Popüler Haberler
Daha fazla
