

XRP Outlook Turns Bearish, But a Final Bull Trap May Come First: Analysis
XRP trades near $1.36 below $1.47 resistance, while analysis points to a possible bull trap before another move lower.
XRP is trading near $1.36 after losing the lower end of its former daily range.
Market analysis now points to a bearish setup, although a brief move higher may still come first.
Analysts are watching whether XRP can retest key resistance before another move lower.
XRP Outlook Turns Bearish Below $1.47
XRP/USD is trading near $1.36 on the daily chart, based on the supplied TradingView data. The token has fallen sharply from its 2025 highs and now trades below a key range.
The main Fibonacci structure runs from about $1.47 to $3.37. XRP has moved below the $1.47 level, which marked the lower side of that structure.
Because of this, $1.47 is now a key resistance area. A daily close above $1.47 would show early recovery strength.
However, XRP remains below that level for now. This keeps the short-term setup weak while price trades near $1.35 to $1.40.
Market analysts also point to a complex corrective phase across XRP and the wider crypto market.
The view says the market may still break lower. Yet, it also notes that a short spike higher could come before that move.
As CoinMarketCap data shows, XRP trades at $1.36 after a small 0.02% gain in 24 hours. Its market cap stands at $84.48 billion, while daily volume is $1.72 billion.
The data also shows a 2.04% volume-to-market-cap ratio, with 61.82 billion XRP in circulation.
XRP has a total supply of 99.98 billion tokens and a maximum supply of 100 billion.
Final Bull Trap May Come Before Another Drop
The current XRP setup allows room for a brief rebound. A move toward $1.47 could test former support as resistance.
If sellers return there, the move may act as a bull trap. The analysis shared with the chart says XRP may “cut a surprise little spike higher.”
It adds that such a move could “shake out any shorts” before price turns lower. This view frames the rebound as part of the wider correction.
A bull trap happens when price rises and draws in buyers. Then, the price fails to hold the move and reverses lower.
In XRP’s case, the $1.47 level is the first area to watch. If XRP breaks above $1.47, traders may next watch $1.87.
That level is the 0.786 Fibonacci area on the chart. Still, a move there would need stronger buying and better market volume.
Read Also:
Indicators Show Weak Momentum
The MACD remains slightly bearish on the daily chart. The MACD line is below the signal line. The histogram is also negative, although the readings are close to the zero line.
This shows that downside momentum is present, but it is not extreme. A bullish MACD cross above zero would improve the recovery case. Until then, the indicator supports a cautious reading.
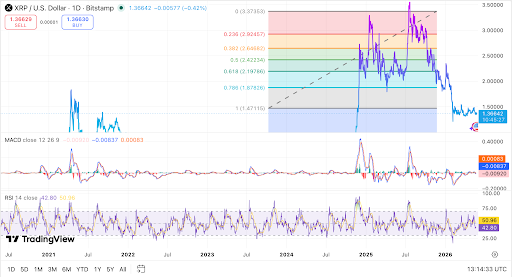 XRP trades below resistance as momentum remains weak. Source: TradingView
The RSI is near 42.46, while its average is close to 50.94. This places XRP below neutral momentum. Buyers have not regained control, and demand remains limited on the chart.
A move above 50 on the RSI would show early improvement. A move above 60 would show stronger buying pressure.
However, a fall below 40 could bring renewed selling risk. The next key downside area sits below $1.30.
A break under that zone could confirm another leg lower. According to the supplied outlook, that move may be the final wave in this XRP cycle.
For now, XRP price action remains bearish to neutral. A short move higher may still test resistance. But the broader setup stays weak while XRP trades below $1.47.
The post XRP Outlook Turns Bearish, But a Final Bull Trap May Come First: Analysis appeared first on Live Bitcoin News.


Ayrıca Şunları da Beğenebilirsiniz
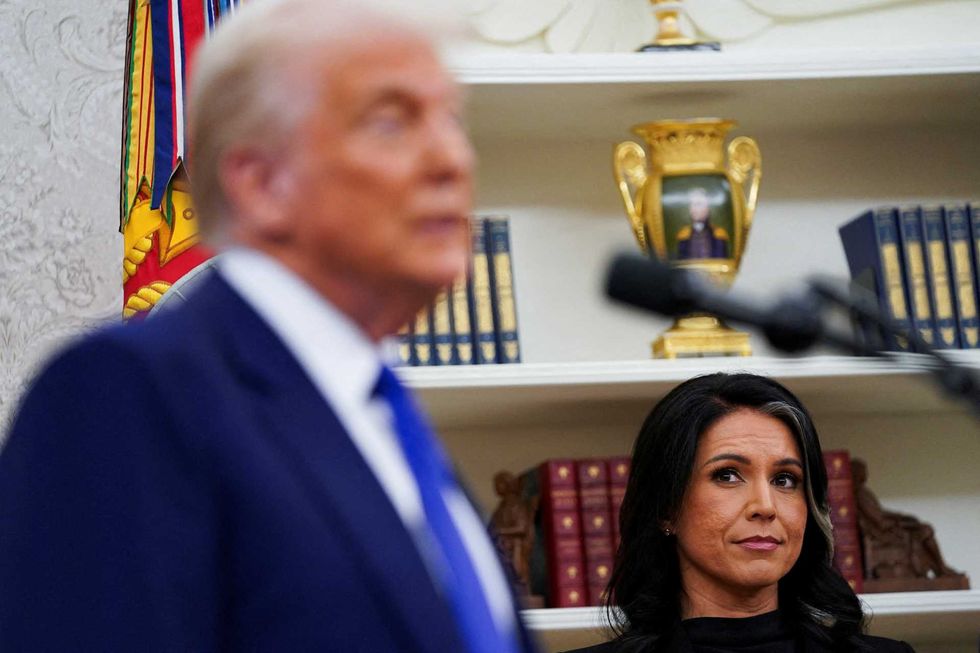
White House forced out Tulsi Gabbard despite claims to the contrary: report

Kevin Warsh Signals Bold Reform Agenda at the Federal Reserve

Critical USDT0 Response to Drift Hack Exposes Stark Contrast in Stablecoin Security Protocols


Popüler Haberler
Daha fazla
