The crypto market opened the trading day, attempting a recovery, with a spike of over 2%, sending the market cap toward $3.13 trillion. With the bullish and bearishThe crypto market opened the trading day, attempting a recovery, with a spike of over 2%, sending the market cap toward $3.13 trillion. With the bullish and bearish

Onyxcoin (XCN) Rockets 12%: Will Bulls Push Higher, or Is a Correction Looming?

2025/12/12 14:21
  • Onyxcoin has jumped over 12%, trading around $0.0056. 
  • The 24-hour trading volume of XCN has exploded by over 285%.

The crypto market opened the trading day, attempting a recovery, with a spike of over 2%, sending the market cap toward $3.13 trillion. With the bullish and bearish shifts happening often, the price actions are directionless and unclear. As of now, not all digital assets are in green; some are still in red, stuck in the trap. 

Meanwhile, Onyxcoin (XCN) has registered a 12.61% jump over the last 24 hours. In the early hours, the asset traded at a low of $0.004995, and the bullish encounter has pushed the XCN price toward a high of $0.0065. To confirm the uptrend, the crucial resistances between $0.005036 and $0.006479 were broken. 

The CoinMarketCap data has reported that at the time of writing, Onyxcoin trades at around the $0.005626 zone, with its market cap reaching $204.65 million. In addition, the daily trading volume of XCN has exploded by over 285.67%, touching the $46.64 million mark.

Can the Onyxcoin Bulls Keep the Momentum Alive?

After a series of red and green candlestick formations, Onyxcoin has currently entered the bullish phase, and the price could climb toward the resistance range at $0.005738. If the upside pressure strengthens, the bulls might send the price high to the former high above $0.005869.

On the downside, upon a bearish rejection at the crucial $0.005547 support level, the bears might gain more traction and trigger a breakdown below the crucial price zone, which could likely push the Onyxcoin price to $0.005416. This makes the bullish reversal a bit more challenging. 

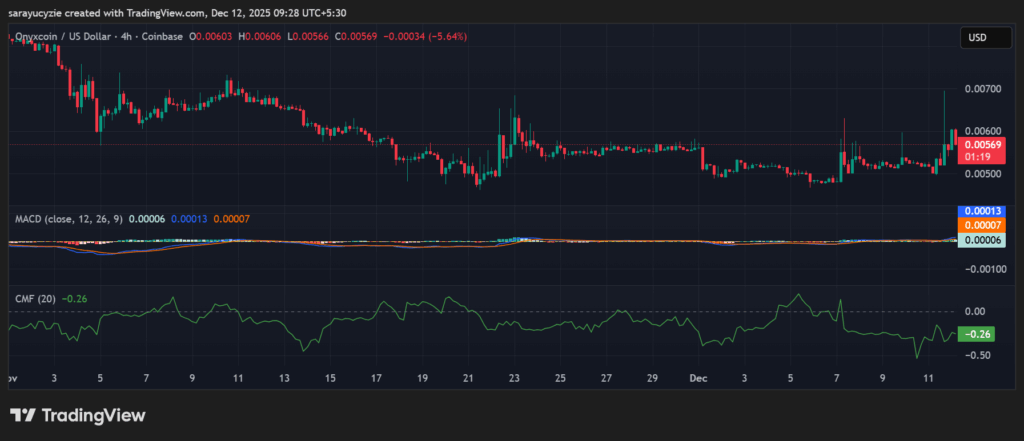
XCN chart (Source: TradingView)

Onyxcoin’s Moving Average Convergence Divergence (MACD) line is above the signal line, implying bullish momentum. Notably, the buyers are gaining control, and the price might be gearing up for an upward move. Besides, the Chaikin Money Flow (CMF) indicator value is at -0.26, with selling pressure dominating the XCN market. The capital is flowing out of the asset, showing more distribution than accumulation.

The Bull-Bear Power (BBP) reading of 0.00034 is slightly positive, and the XCN bulls have a very small edge over bears. With the mild buying pressure, the momentum is not strong enough to confirm a steady uptrend. Moreover, Onyxcoin’s daily Relative Strength Index (RSI) is positioned at 56.72. It indicates the asset’s neutral-to-bullish zone. The momentum is leaning slightly positive, with the buyers currently having the upper hand.

Top Updated Crypto News

Terraform Co-Founder Receives 15-Years Prison Sentence

Piyasa Fırsatı
ONYXCOIN Logosu
ONYXCOIN Fiyatı(XCN)
$0.0048616
$0.0048616$0.0048616
-3.98%
USD
ONYXCOIN (XCN) Canlı Fiyat Grafiği
Sorumluluk Reddi: Bu sitede yeniden yayınlanan makaleler, halka açık platformlardan alınmıştır ve yalnızca bilgilendirme amaçlıdır. MEXC'nin görüşlerini yansıtmayabilir. Tüm hakları telif sahiplerine aittir. Herhangi bir içeriğin üçüncü taraf haklarını ihlal ettiğini düşünüyorsanız, kaldırılması için lütfen service@support.mexc.com ile iletişime geçin. MEXC, içeriğin doğruluğu, eksiksizliği veya güncelliği konusunda hiçbir garanti vermez ve sağlanan bilgilere dayalı olarak alınan herhangi bir eylemden sorumlu değildir. İçerik, finansal, yasal veya diğer profesyonel tavsiye niteliğinde değildir ve MEXC tarafından bir tavsiye veya onay olarak değerlendirilmemelidir.

Ayrıca Şunları da Beğenebilirsiniz

XRP price weakens at critical level, raising risk of deeper pullback

XRP price weakens at critical level, raising risk of deeper pullback

Markets Share Share this article
Copy linkX (Twitter)LinkedInFacebookEmail
XRP price weakens at critical level, raising
Paylaş
Coindesk2025/12/16 11:34
Wormhole Unveils W Token 2.0 with Enhanced Tokenomics

Wormhole Unveils W Token 2.0 with Enhanced Tokenomics

The post Wormhole Unveils W Token 2.0 with Enhanced Tokenomics appeared on BitcoinEthereumNews.com. Joerg Hiller Sep 17, 2025 13:57 Wormhole introduces W Token 2.0, featuring upgraded tokenomics, a strategic Wormhole Reserve, and a 4% base yield, aiming to optimize ecosystem growth and align incentives. Wormhole has announced a significant upgrade to its native token, unveiling the W Token 2.0. This upgrade introduces new tokenomics including the establishment of a Wormhole Reserve, a 4% base yield, and an optimized unlock schedule, marking a pivotal development in the ecosystem, according to Wormhole. The W Token Evolution Launched in October 2020, Wormhole’s W token has been central to the platform’s mission of creating a connected internet economy. The latest upgrade aims to enhance the token’s utility across more than 40 blockchains. With a capped supply of 10 billion, the W token supports governance, staking, and ecosystem growth, aligning incentives for network security and development. Introducing the Wormhole Reserve The Wormhole Reserve will accumulate value from both onchain and offchain activities, supporting the ecosystem’s expansion. As Wormhole adoption grows, the token will capture value through network expansions and ecosystem applications, ensuring that growth is directly reflected in the token’s value. 4% Base Yield and Governance Rewards Wormhole 2.0 introduces a 4% base yield for W holders who actively participate in governance. The yield, derived from existing token supplies and protocol revenues, is designed to incentivize active participation without inflating the token supply. Optimized Unlock Schedule Updating its token release schedule, Wormhole replaces annual cliffs with bi-weekly unlocks, starting October 3, 2025. This change aims to reduce market pressure and provide a more stable environment for investors and contributors. The bi-weekly schedule will span over 4.5 years, affecting categories such as Guardian Nodes and Community & Launch. Wormhole’s Future Vision With these upgrades, Wormhole aims to expand its role as…
Paylaş
BitcoinEthereumNews2025/09/18 15:48
Crucial US Stock Market Update: What Wednesday’s Mixed Close Reveals

Crucial US Stock Market Update: What Wednesday’s Mixed Close Reveals

BitcoinWorld Crucial US Stock Market Update: What Wednesday’s Mixed Close Reveals The financial world often keeps us on our toes, and Wednesday was no exception. Investors watched closely as the US stock market concluded the day with a mixed performance across its major indexes. This snapshot offers a crucial glimpse into current investor sentiment and economic undercurrents, prompting many to ask: what exactly happened? Understanding the Latest US Stock Market Movements On Wednesday, the closing bell brought a varied picture for the US stock market. While some indexes celebrated gains, others registered slight declines, creating a truly mixed bag for investors. The Dow Jones Industrial Average showed resilience, climbing by a notable 0.57%. This positive movement suggests strength in some of the larger, more established companies. Conversely, the S&P 500, a broader benchmark often seen as a barometer for the overall market, experienced a modest dip of 0.1%. The technology-heavy Nasdaq Composite also saw a slight retreat, sliding by 0.33%. This particular index often reflects investor sentiment towards growth stocks and the tech sector. These divergent outcomes highlight the complex dynamics currently at play within the American economy. It’s not simply a matter of “up” or “down” for the entire US stock market; rather, it’s a nuanced landscape where different sectors and company types are responding to unique pressures and opportunities. Why Did the US Stock Market See Mixed Results? When the US stock market delivers a mixed performance, it often points to a tug-of-war between various economic factors. Several elements could have contributed to Wednesday’s varied closings. For instance, positive corporate earnings reports from certain industries might have bolstered the Dow. At the same time, concerns over inflation, interest rate policies by the Federal Reserve, or even global economic uncertainties could have pressured growth stocks, affecting the S&P 500 and Nasdaq. Key considerations often include: Economic Data: Recent reports on employment, manufacturing, or consumer spending can sway market sentiment. Corporate Announcements: Strong or weak earnings forecasts from influential companies can significantly impact their respective sectors. Interest Rate Expectations: The prospect of higher or lower interest rates directly influences borrowing costs for businesses and consumer spending, affecting future profitability. Geopolitical Events: Global tensions or trade policies can introduce uncertainty, causing investors to become more cautious. Understanding these underlying drivers is crucial for anyone trying to make sense of daily market fluctuations in the US stock market. Navigating Volatility in the US Stock Market A mixed close, while not a dramatic downturn, serves as a reminder that market volatility is a constant companion for investors. For those involved in the US stock market, particularly individuals managing their portfolios, these days underscore the importance of a well-thought-out strategy. It’s important not to react impulsively to daily movements. Instead, consider these actionable insights: Diversification: Spreading investments across different sectors and asset classes can help mitigate risk when one area underperforms. Long-Term Perspective: Focusing on long-term financial goals rather than short-term gains can help weather daily market swings. Stay Informed: Keeping abreast of economic news and company fundamentals provides context for market behavior. Consult Experts: Financial advisors can offer personalized guidance based on individual risk tolerance and objectives. Even small movements in major indexes can signal shifts that require attention, guiding future investment decisions within the dynamic US stock market. What’s Next for the US Stock Market? Looking ahead, investors will be keenly watching for further economic indicators and corporate announcements to gauge the direction of the US stock market. Upcoming inflation data, statements from the Federal Reserve, and quarterly earnings reports will likely provide more clarity. The interplay of these factors will continue to shape investor confidence and, consequently, the performance of the Dow, S&P 500, and Nasdaq. Remaining informed and adaptive will be key to understanding the market’s trajectory. Conclusion: Wednesday’s mixed close in the US stock market highlights the intricate balance of forces influencing financial markets. While the Dow showed strength, the S&P 500 and Nasdaq experienced slight declines, reflecting a nuanced economic landscape. This reminds us that understanding the ‘why’ behind these movements is as important as the movements themselves. As always, a thoughtful, informed approach remains the best strategy for navigating the complexities of the market. Frequently Asked Questions (FAQs) Q1: What does a “mixed close” mean for the US stock market? A1: A mixed close indicates that while some major stock indexes advanced, others declined. It suggests that different sectors or types of companies within the US stock market are experiencing varying influences, rather than a uniform market movement. Q2: Which major indexes were affected on Wednesday? A2: On Wednesday, the Dow Jones Industrial Average gained 0.57%, while the S&P 500 edged down 0.1%, and the Nasdaq Composite slid 0.33%, illustrating the mixed performance across the US stock market. Q3: What factors contribute to a mixed stock market performance? A3: Mixed performances in the US stock market can be influenced by various factors, including specific corporate earnings, economic data releases, shifts in interest rate expectations, and broader geopolitical events that affect different market segments uniquely. Q4: How should investors react to mixed market signals? A4: Investors are generally advised to maintain a long-term perspective, diversify their portfolios, stay informed about economic news, and avoid impulsive decisions. Consulting a financial advisor can also provide personalized guidance for navigating the US stock market. Q5: What indicators should investors watch for future US stock market trends? A5: Key indicators to watch include upcoming inflation reports, statements from the Federal Reserve regarding monetary policy, and quarterly corporate earnings reports. These will offer insights into the future direction of the US stock market. Did you find this analysis of the US stock market helpful? Share this article with your network on social media to help others understand the nuances of current financial trends! To learn more about the latest stock market trends, explore our article on key developments shaping the US stock market‘s future performance. This post Crucial US Stock Market Update: What Wednesday’s Mixed Close Reveals first appeared on BitcoinWorld.
Paylaş
Coinstats2025/09/18 05:30