

Ethereum Lags Behind Bitcoin: Is it an Early Warning of a Hidden Opportunity?

The post Ethereum Lags Behind Bitcoin: Is it an Early Warning of a Hidden Opportunity? appeared first on Coinpedia Fintech News
Ever since the February drop, the Ethereum price has been trading within a range with predefined resistance and support. In the times when the Bitcoin price is attempting larger moves, ranging from lows around $62,000 to as high as $75,600, the ETH price is failing to secure a range above 2,200. However, the price has been defending the pivotal support close to $2000 that may appear bullish, but the underlying data tells a different story.
Currently, the momentum is weak, and capital is not flowing back to ETH, and this divergence raises a critical question: Is Ethereum preparing for a delayed breakout, or is this an early warning of deeper weakness?
ETH/BTC Downtrend Signals Weakness Despite ETH/USD Price Stability
Ethereum price is showing signs of stabilization on the price chart, but a deeper look at the ETH/BTC pair reveals a more critical signal; it continues to underperform Bitcoin in the current market cycle. The ETH/BTC chart remains locked in a clear downtrend, marked by consistent lower highs and a sharp breakdown in February. This keeps Ethereum in a relative weakness phase, rather than signaling a true reversal.
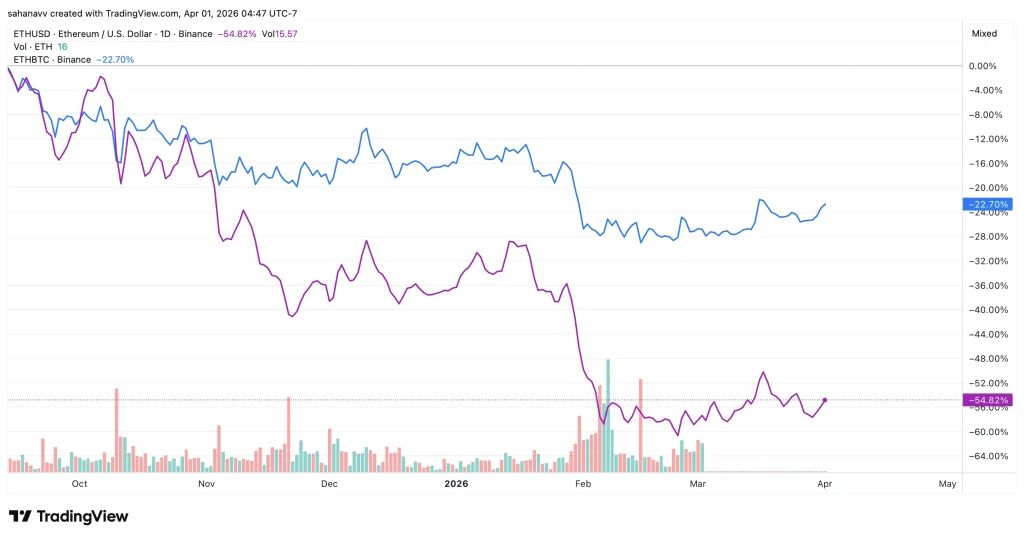
This divergence between the ETH price and the ETH/BTC performance is significant. While ETH/USD appears stable, the relative decline indicates that capital is not flowing back into Ethereum at the same pace as Bitcoin. Instead, the current market environment reflects a Bitcoin-led recovery, where BTC continues to absorb liquidity while ETH lags.
From a trading perspective, this structure does not support a bullish bias yet. As long as the ETH/BTC pair fails to break its downtrend and reclaim key levels, any upside in Ethereum price should be viewed as limited and conditional, not a confirmed trend shift.
Ethereum Dominance Drops as Bitcoin Gains Control — Capital Rotation Intensifies
Ethereum price is continuing to lose ground in the broader market, with Ethereum dominance (ETH.D) holding near its lows despite a recent bounce. The structure remains weak, with no confirmed higher high, signaling that ETH is not regaining meaningful market share. At the same time, Bitcoin dominance (BTC.D) remains elevated, showing consistent relative strength. This divergence confirms a clear shift in capital flow; liquidity is favoring Bitcoin while Ethereum lags.
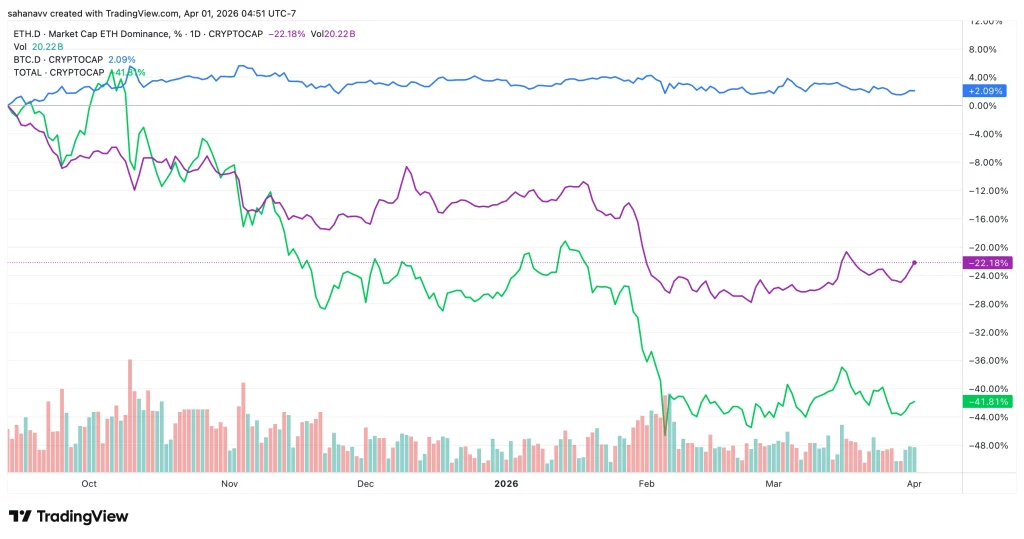
The total crypto market has attempted a recovery following the recent correction, but Ethereum has failed to capture a proportional share of that move. This indicates that the current environment is not driven by altcoin expansion but by a Bitcoin-led recovery phase, where capital is concentrated rather than broadly distributed.
As long as Ethereum dominance remains suppressed and fails to reclaim higher levels, ETH is likely to continue underperforming. A meaningful shift in trend will require sustained strength in ETH.D alongside a cooling in BTC dominance, confirming that capital is rotating back into Ethereum.
What This Means for the Retailers
The continued downtrend in the ETH/BTC pair highlights relative weakness, while declining ETH dominance confirms that Ethereum is losing market share. At the same time, Bitcoin dominance remains elevated, signaling that liquidity is concentrated in Bitcoin. This combination defines the current environment as BTC-led, not ETH-driven.
At this stage, Ethereum does not offer a confirmed trend. Instead, it presents a conditional setup where confirmation is required before taking directional bias. A shift in trend will only occur if Ethereum shows clear strength across multiple metrics:
- ETH/BTC breaks its downtrend and forms higher highs
- ETH dominance (ETH.D) starts trending upward
- Price reclaims key resistance levels with strong momentum
Invalidation of Bullish Setup
- Continued weakness in ETH/BTC
- Failure of ETH dominance to recover
- Rejection at key resistance levels
Collectively, the Ethereum price is not in a confirmed bullish trend—it is in a setup phase with weak relative positioning. Until capital rotates back into ETH from Bitcoin, and key structures are reclaimed, any upside should be treated as limited and reactive, not a sustained move.


Ayrıca Şunları da Beğenebilirsiniz

Solana Stablecoin Volume Hits $650B, Price Eyes Key $85 Level

New Hampshire to Issue $100M Bitcoin-Backed Bond With Speculative Moody’s Rating


